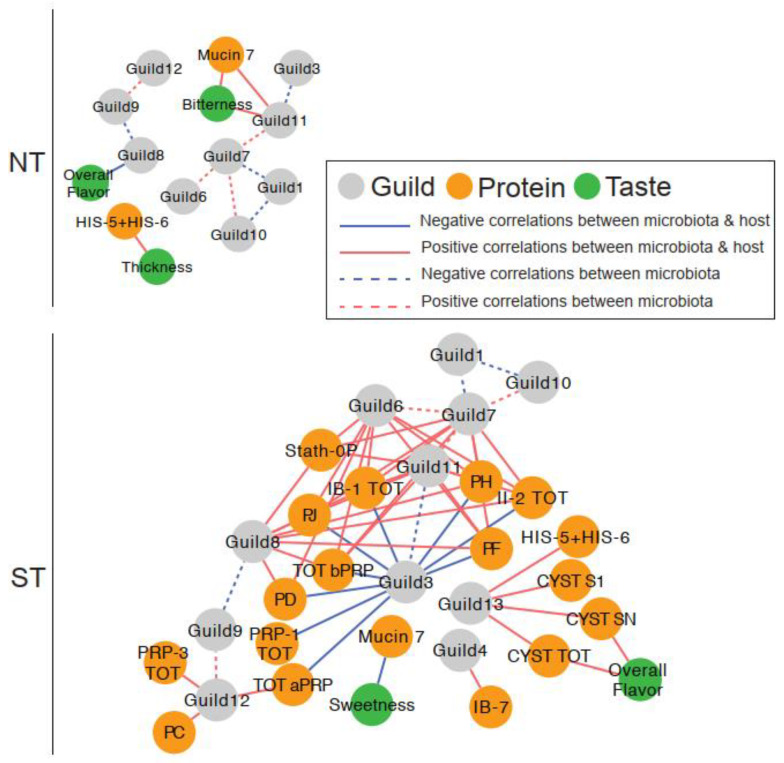
Figure 8.
The associations between taste, salivary proteins, and oral microbiota were more complex in PROP STs than in NTs. In the correlation networks, solid edges represent the correlations between taste and guilds, between salivary proteins and guilds, and between taste and salivary proteins. Dashed edges represent the correlations between guilds. The color of the edges represents the positive (red) and negative (blue) correlations. All correlations with adjusted p < 0.25 were shown in the networks. Salivary protein abbreviations are explained in Supplementary Table S1.

