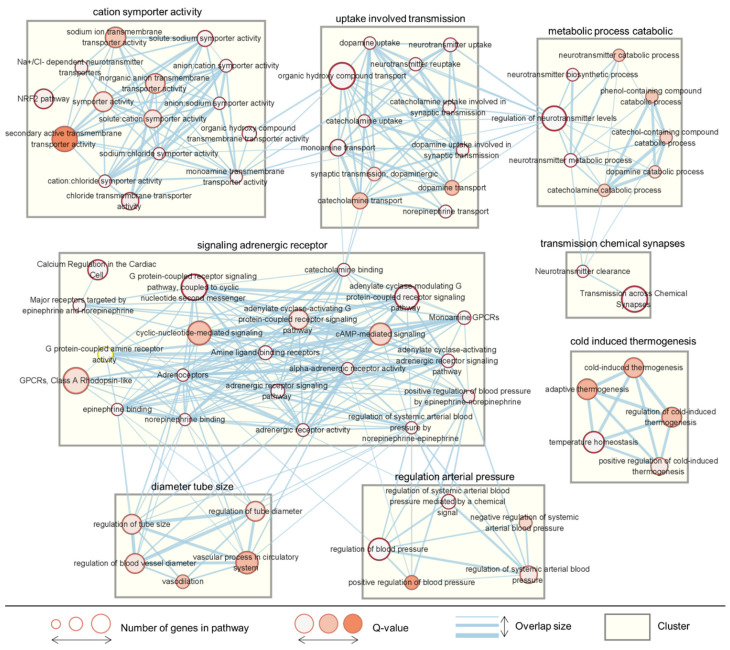
Figure 4.
Network analysis of the enriched pathways in the target genes of the HG. A representative functional map of the associated pathways was constructed using EnrichmentMap. Nodes represent the enriched pathways and links represent the similarities between them. The size and color of the nodes indicate the number of genes included in the pathway and the statistical significance of the Q-value, respectively. The thickness of the link indicates the degree of overlap of the genes between the two connected pathways. The rectangular box indicates the identified cluster.

