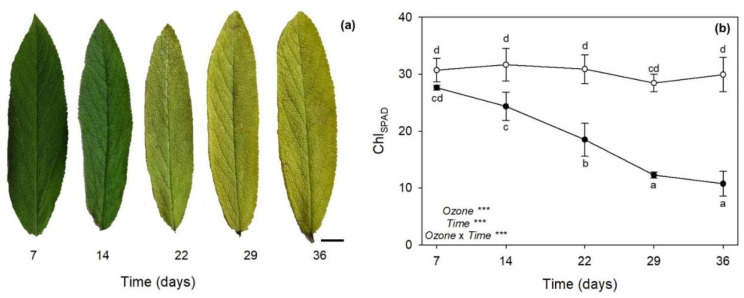
Figure 1.
(a) Leaf symptoms of Salvia officinalis exposed to 120 ppb of ozone (5 h day−1) for 7, 14, 22, 29 and 36 consecutive days. Bar: 1 cm. (b) Variation in relative chlorophyll content (determined in SPAD values, ChlSPAD) in leaves of sage exposed to charcoal-filtered air (open circle) or to 120 ppb of ozone (5 h day−1) for 36 consecutive days (closed circle). Data are shown as mean ± standard deviation. p levels for the effects of ozone, time, and their interaction from a one-way repeated measures ANOVA are shown (***: p ≤ 0.001). According to Tukey’s HSD post hoc test, different letters indicate significant differences among means (p ≤ 0.05).

