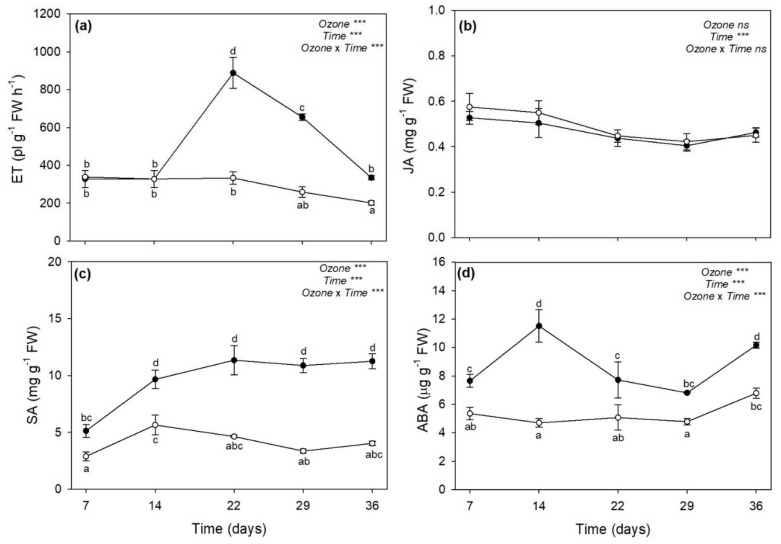
Figure 5.
Variation in (a) ethylene (ET), (b) jasmonic acid (JA), (c) total salicylic acid (free plus conjugated forms of SA), and (d) abscisic acid (ABA) contents in leaves of sage exposed to charcoal-filtered air (open circle) or to 120 ppb of ozone (5 h day−1) for 36 consecutive days (closed circle). Data are shown as mean ± standard deviation. p levels for the effects of ozone, time, and their interaction from a two-way ANOVA are shown (***: p ≤ 0.001, ns: p > 0.05). According to Tukey’s HSD post hoc test, different letters indicate significant differences among means (p ≤ 0.05). FW: fresh weight.

