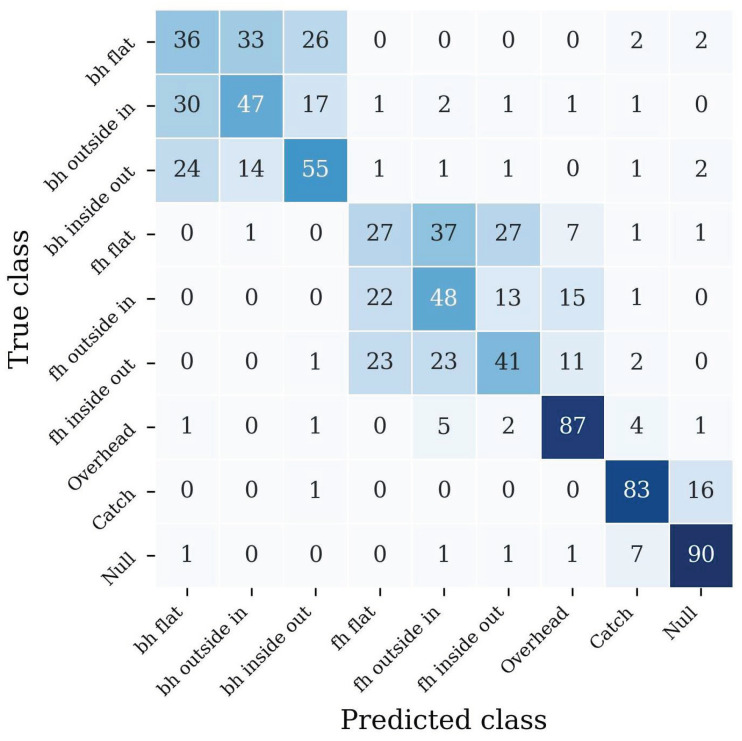
Figure 5.
Confusion matrix of classification performance. The backhand throws are abbreviated as bh and the forehand throws as fh. The true class is given on the left and the predicted class on the bottom. Each entry is normalized according to its true class and denoted in percentage. Thus, the highest possible value is 100, and the smallest value is zero.

