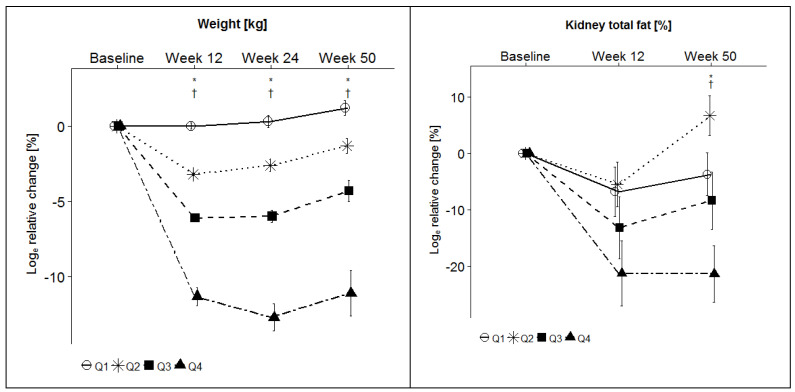
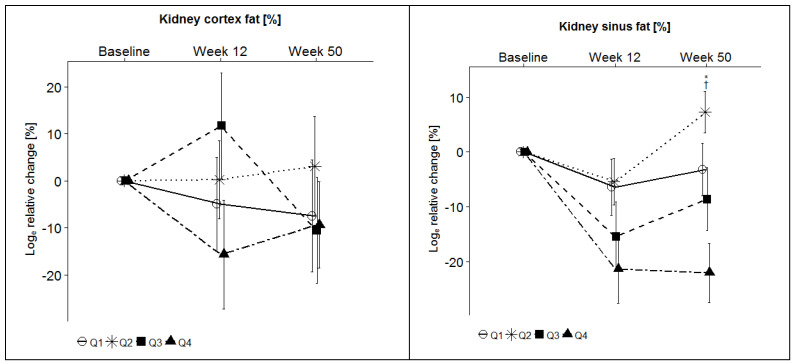
Figure 2.
Relative changes of weight, total kidney fat content, kidney cortex fat content and kidney sinus fat content, n = 137. Data are shown as mean ± SEM for Log relative change. The baseline values serve as reference. Abbreviations: SEM, standard error of the mean; †, significant between the extreme quartiles 1 and 4; *, significant for all quartiles. The figure of weight change was published previously [21,34].


