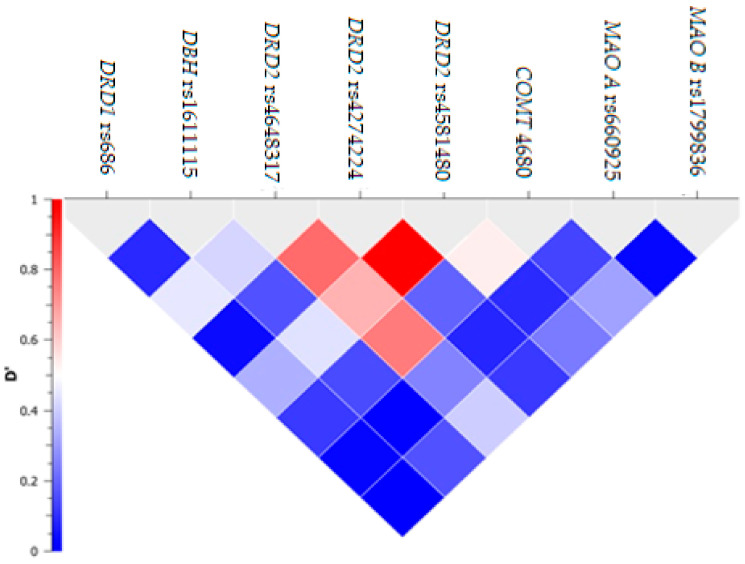
Figure 1.
Linkage disequilibrium between selected single-nucleotide polymorphisms (SNPs). On y axis, D’ represents the coefficient of linkage disequilibrium between the tested SNPs (represented on x axis). DRD1: dopaminergic receptor D1; DRD2: dopaminergic receptor D2; DBH: dopaminergic beta hydroxylase; MAO B: monoamine oxidase B; MAO A: monoamine oxidase A; COMT: catechol O methyl transferase.

