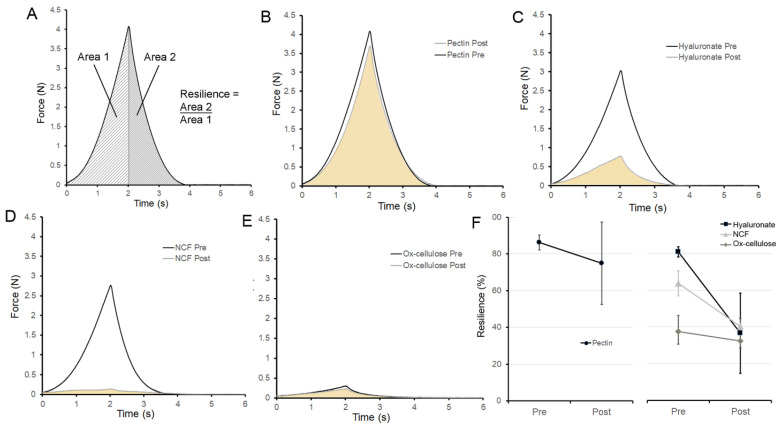
Figure 5.
Resilience of pectin films before and after water-induced repair. (A) A 5 mm stainless steel sphere was used to probe the pectin films to a displacement of 1 mm. The resilience was calculated as the ratio between absorbed energy during elastic deformation (Area 1) and the released energy upon unloading (Area 2). (B) Characteristic resilience curve of pectin films is shown before (black) and after (gray) burst fracture and water-induced repair. Similar resilience curves are shown for sodium hyaluronate (C), NCF (D), and ox-cellulose (E). (F) Summary of resilience replicates (N = 10) is shown. Pectin resilience was significantly greater than the polymer controls (p < 0.001). The mean ± 1 standard deviation (SD) is shown. The resilience mechanics were assessed at a water content of 8% (w/w).

