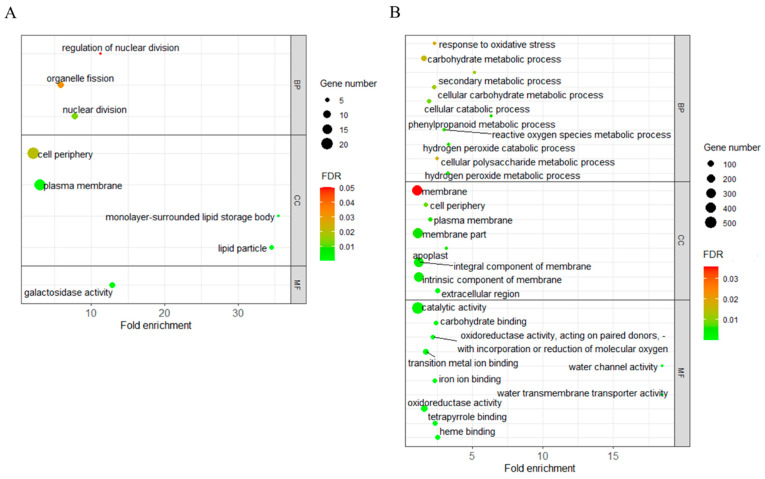
Figure 4.
GO enrichment analysis of L220-specifically expressed LTGA genes (DEGs) with up- (A) and downregulated (B) expression. The size of the dot indicates the number of DEGs involved in the GO category. The color scale indicates the significance level (FDR). The rich factor is the ratio between the number of DEGs and all genes enriched in the category.

