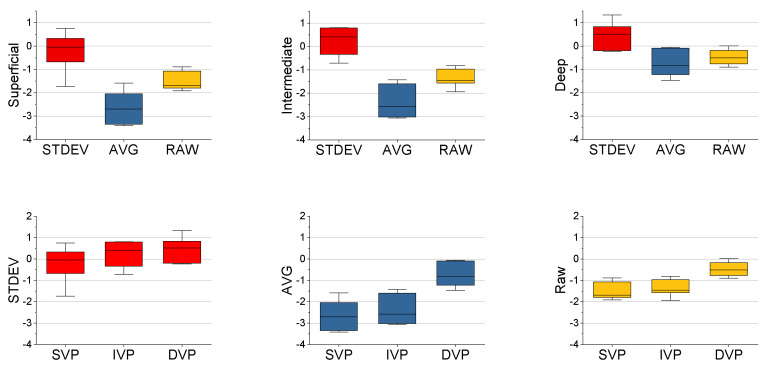
Figure 10.
Comparison of CNR by vascular plexus and frame averaging method (n = 7). Boxplots of the CNR of the vascular plexuses separated by frame averaging methods (top), showing the highest CNR with the STDEV averaging, followed by the raw images, and finally the mean averaging. Boxplots for the CNR of the frame averaging methods were plotted as well (bottom), displaying the highest CNR in the deep vascular plexus, followed by the intermediate and superficial vascular plexuses. For all conditions, both paired t-test and ANOVA showed significant differences (p < 0.05).

