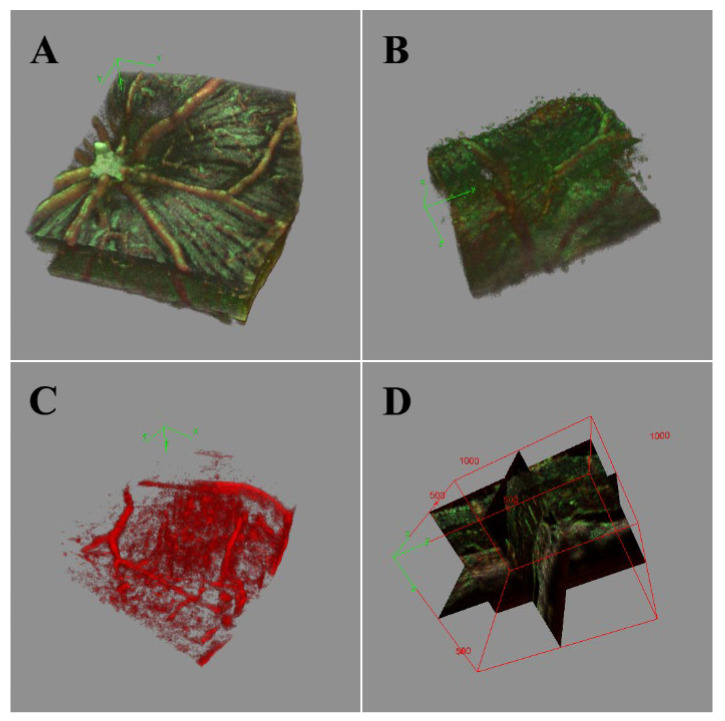
Figure 13.
3D-rendered volume of normal retinal region (A) and CNV lesion with edema (B–D). The red portion of the volume shows the result of STDEV frame averaging with increased microvasculature specificity, while the green portion of the volume shows the result of mean frame averaging. (A) Organized NFL tracks and vascular branching. (B) The bulge of CNV disrupting the NFL and vasculature. The edemas are apparent in the 3D render of the STDEV vasculature (C) and visualized in 3D orthographic views (D).

