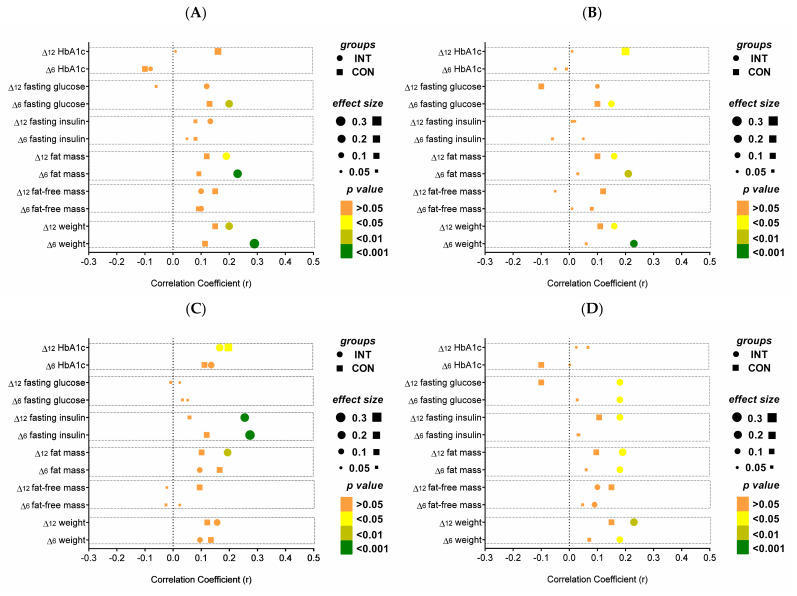
Figure 2.
Correlation of changes in clinical parameters with changes in (A) SBP, (B) DBP, (C) resting HR, and (D) PWV after 6 and 12 months of intervention. Effect size and significance are shown for INT and CON. Δ6 = change after 6 months; Δ12 = change after 12 months. CON, control group; DBP, diastolic blood pressure; HbA1c, hemoglobin A1c; HR, resting heart rate; INT, intervention group; PWV, pulse wave velocity; SBP, systolic blood pressure.

