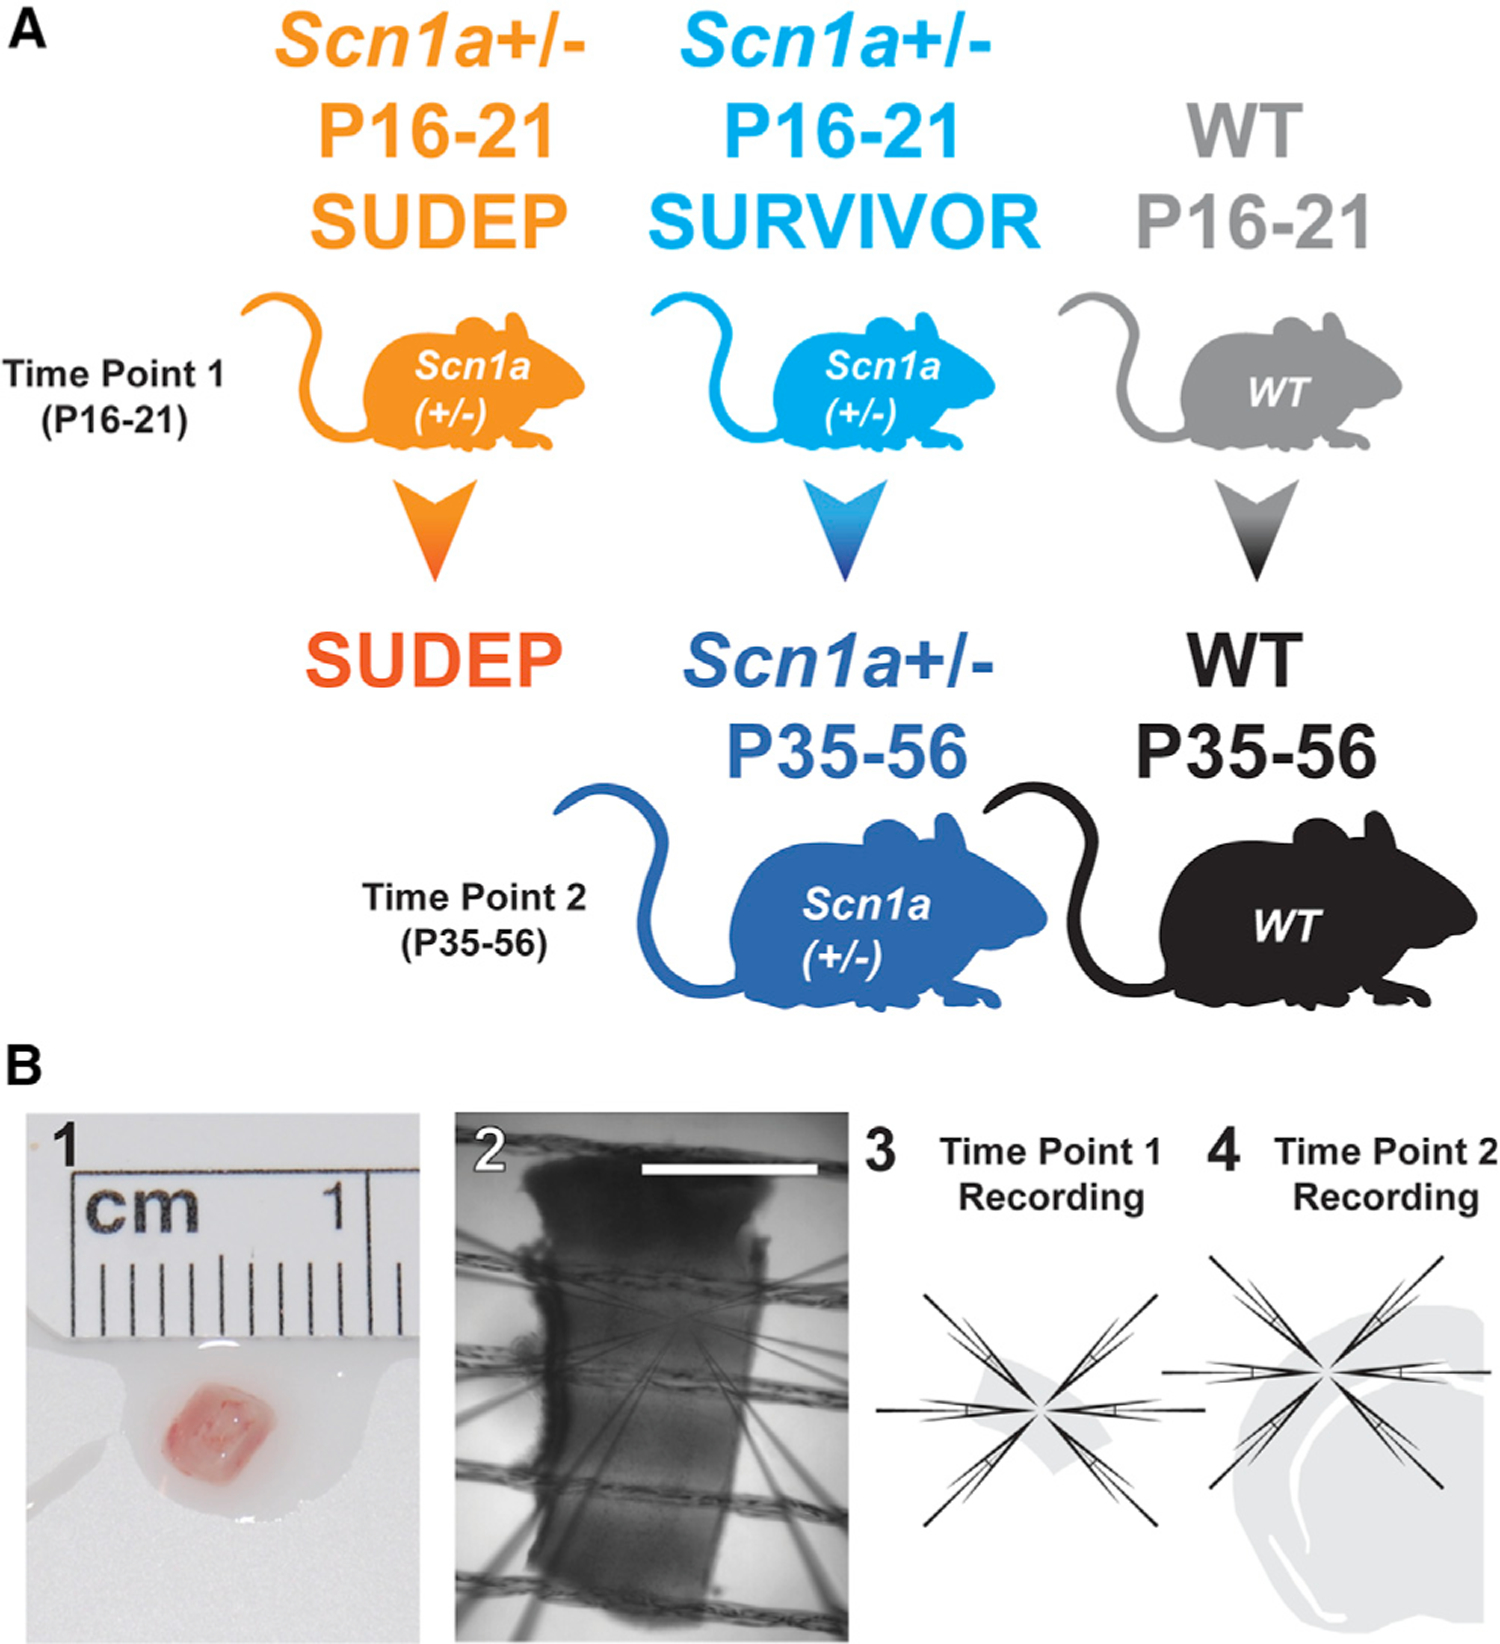
Figure 1. Analysis of PV interneurons across development.

(A) Five experimental groups included (1) pre-weaning Scn1a+/− mice recorded at P16–P21 via mini-slice that were deceased by P35 (Scn1a+/− P16–P21 SUDEP; orange), (2) Scn1a+/− mice recorded at P16–P21 via mini-slice that survive to P35–P56 (Scn1a+/− P16–P21 SURVIVOR; light blue), (3) surviving Scn1a+/− mice recorded at P35–P56 via conventional acute brain-slice techniques (Scn1a+/− P35–P56; dark blue; i.e., the same mice as in Scn1a+/− P16–P21 SURVIVOR mice but recorded again at P35–P56 to generate a separate dataset), (4) pre-weaning wild-type (WT) littermates at P16–P21 (WT P16–P21; gray), and (5) young adult WT recorded at P35–P56 via acute brain slice (WT P35–P56; black; i.e., the same mice as in WT P16–P21).
(B) Mini-slices (1–3) were generated from biopsies of somatosensory neocortex of P16–P21 mice. Acute brain slices (4) were generated using standard techniques from surviving Scn1a+/− P35–P56 mice and from age-matched WT P35–P56 littermates. Scale bar in (2), 1 mm.
