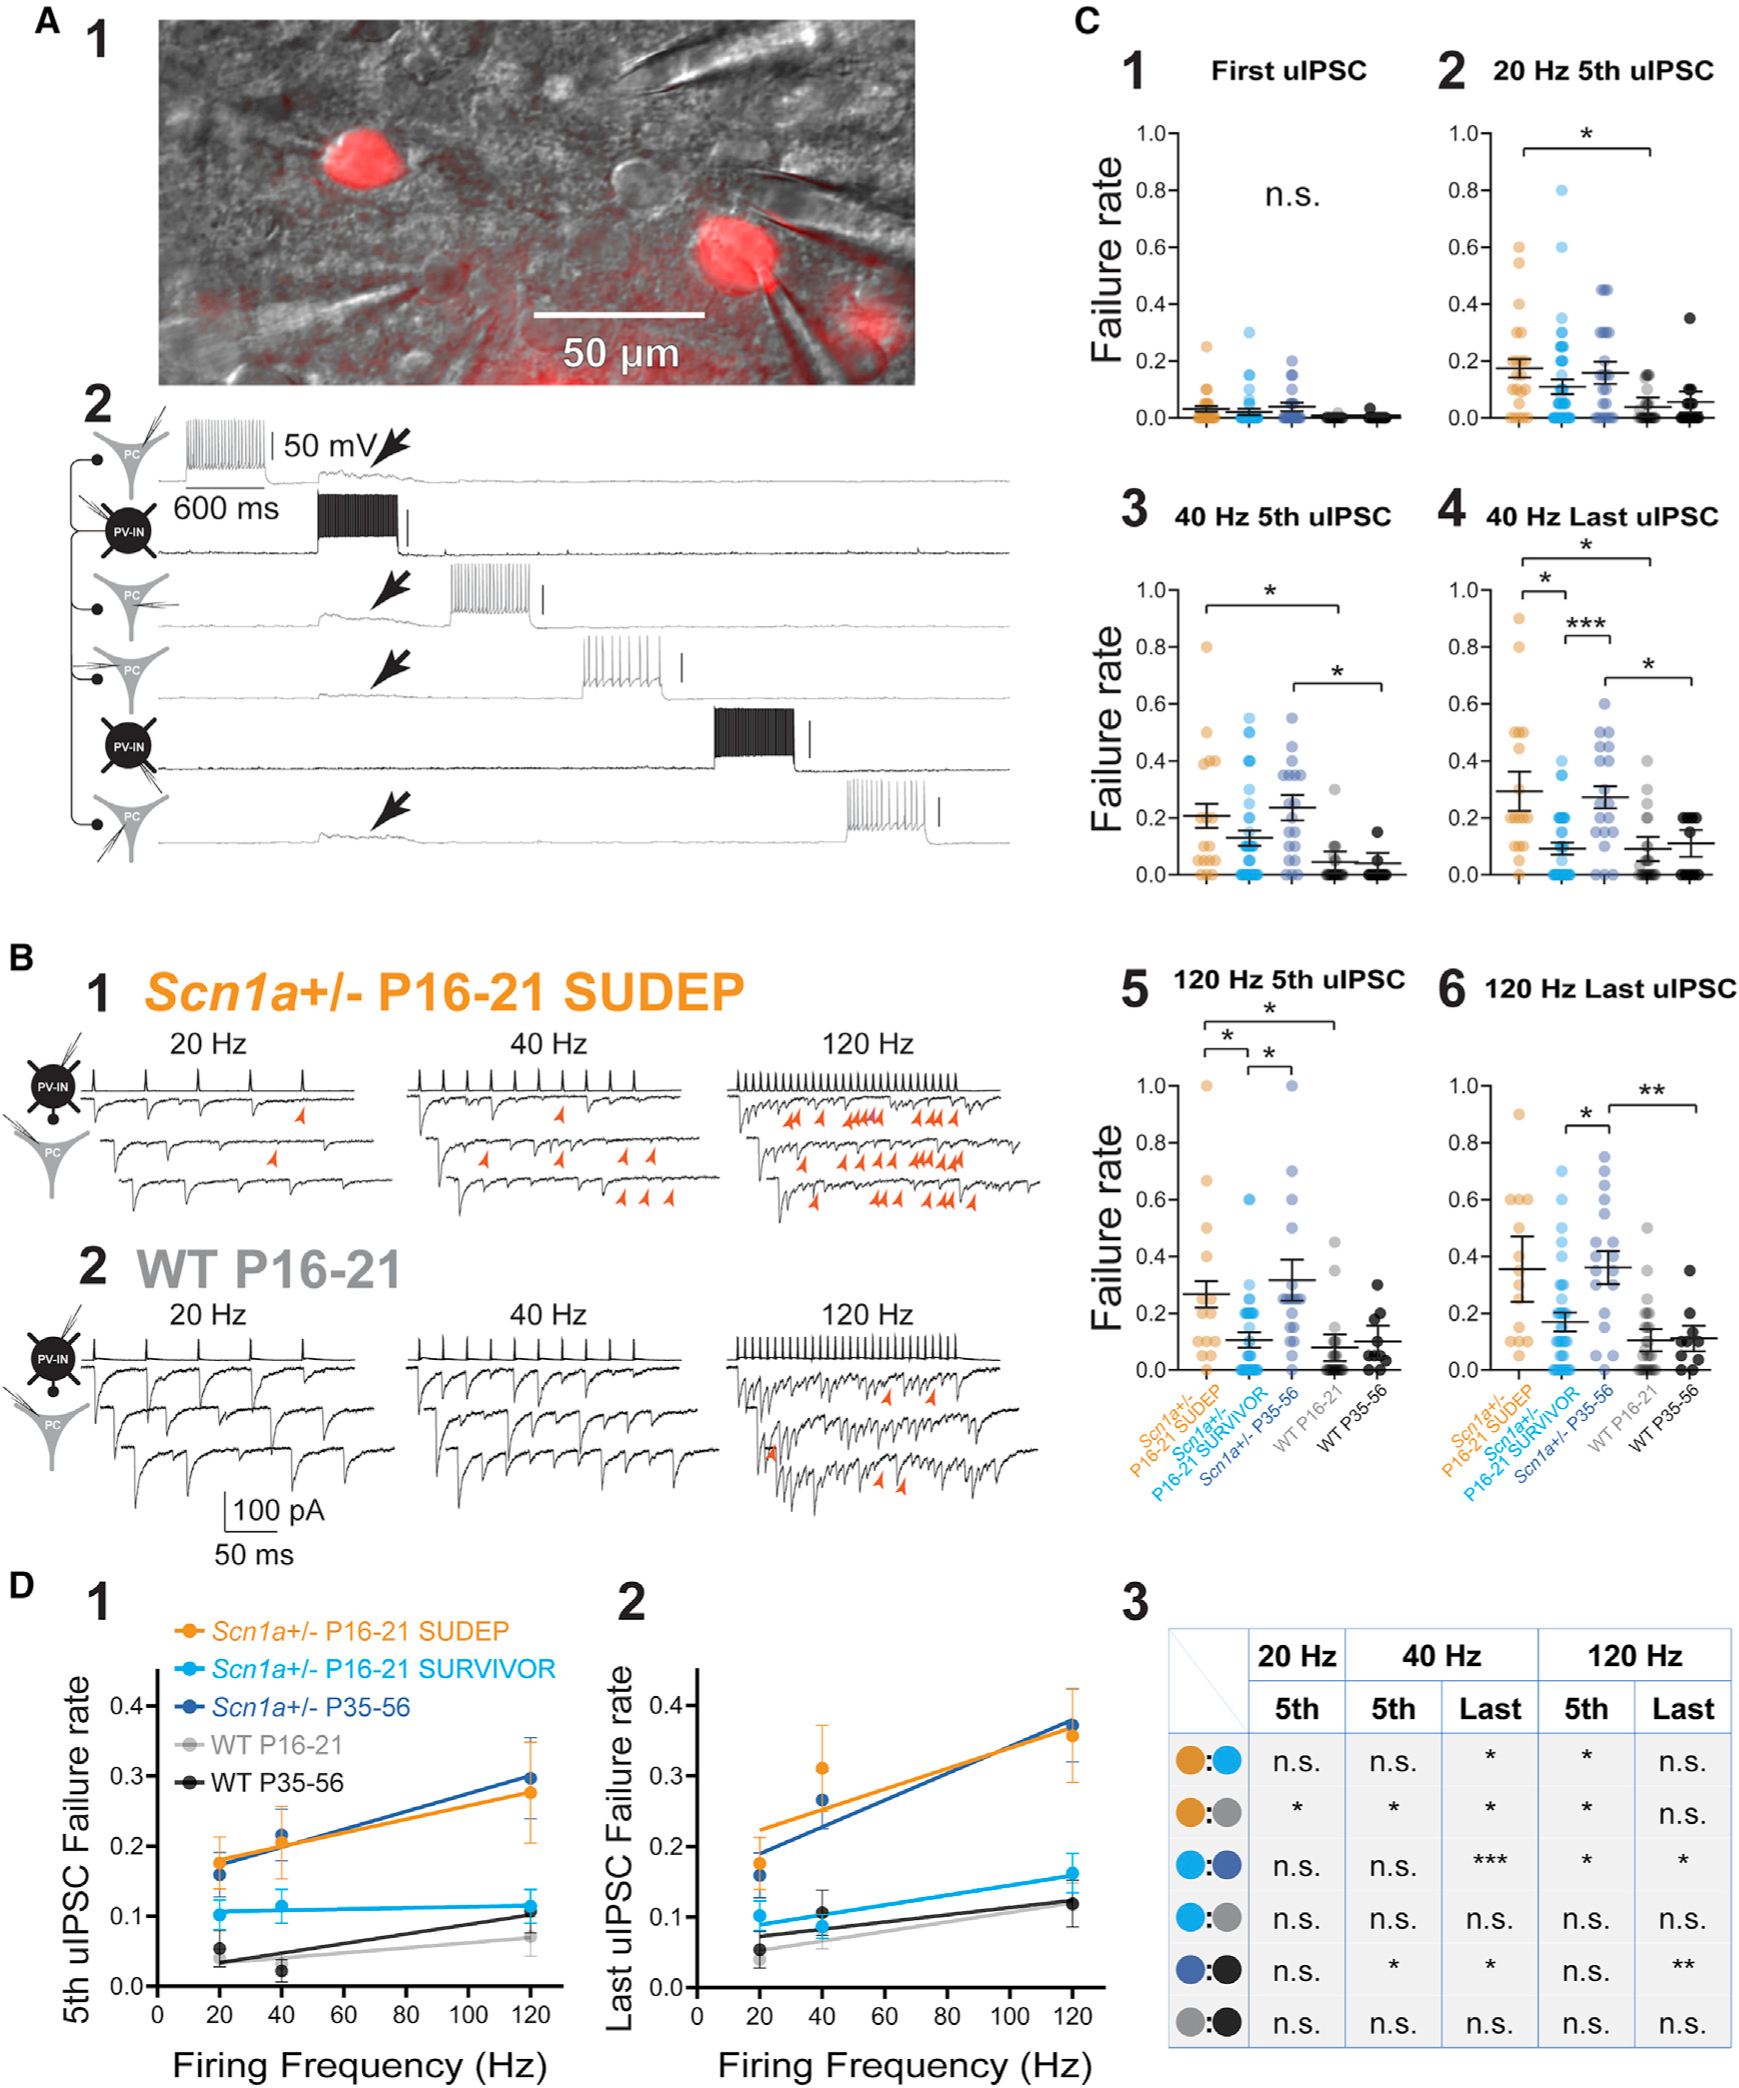
Figure 3. Persistent impairments in AP propagation in PV interneurons.

(A) Multiple whole-cell recording from tdTomato-positive PV-INs as well as principal cells. Shown is a representative image of two PV-INs (cells no. 2 and no. 5) and four PCs (cells no. 1, no. 3, no. 4, and no. 6) in the mini-slice preparation under infrared differential interference contrast (IR-DIC) and corresponding epifluorescence (1;showing tdTomato-positive PV-INs). Four synaptic connections were identified from cell no. 2 (in black),which produce depolarization in cells no. 1, no. 2, no. 3, and no. 4 (arrows; in gray; 2).
(B) Representative examples of evoked unitary inhibitory postsynaptic currents (uIPSCs) in an Scn1a+/− P16–P21 SUDEP mouse (1)and age-matched WT P16–P21 littermate (2). Presynaptic PV-INs were recorded in current clamp, and IPSCs were recorded in PCs in voltage clamp as inward currents. Red arrowheads, synaptic failures.
(C) Summary data for failure rate (range, 0 to 1), calculated as the number of failures divided by total stimuli (failures plus number of success). See Table S1. Note that failures occurred at frequencies that PV-INs could clearly generate at the soma and were more pronounced with successive stimulation (4 and 6) yet were still present early in trains (3 and 5).
(D) Relationship between failure rate and presynaptic firing frequency across groups. *p < 0.05; **p < 0.01; ***p < 0.001; n.s., not significant; via mixed-effects modeling. See Table S1.
