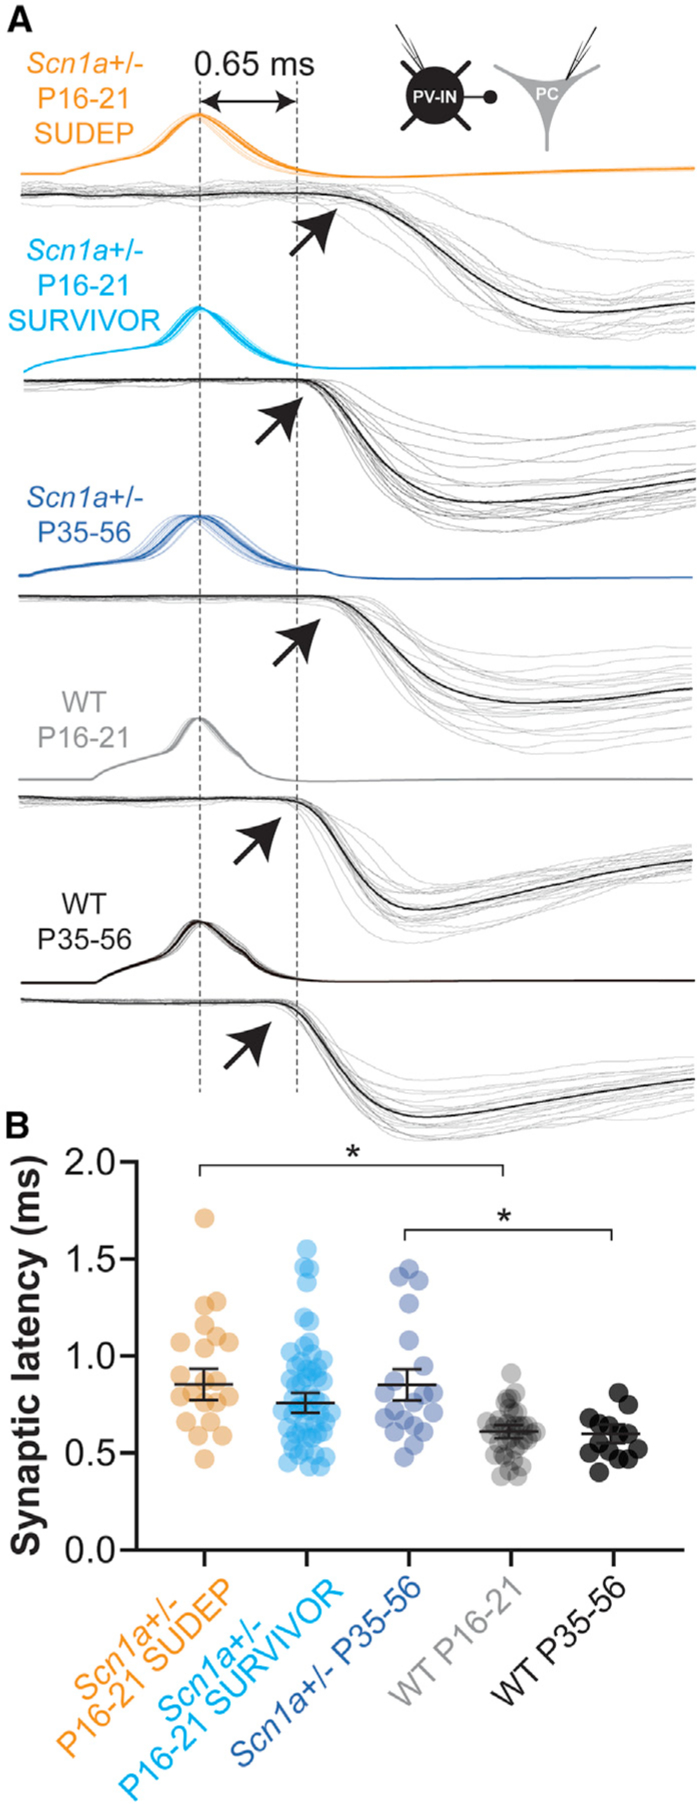
Figure 4. Prolonged synaptic latency at PV interneuron connections.

(A) Representative examples from each group illustrating synaptic latency, measured from peak of the presynaptic AP (dotted line at left) to onset (arrows) of the postsynaptic uIPSC (mean, black; individual traces, gray). The dotted line at right corresponds to a latency of 0.65 ms, to approximate the mean value for WT mice (at P16–P21 and P35–P56).
(B) Summary data. *p < 0.05 via mixed-effects modeling.
See Table S1.
