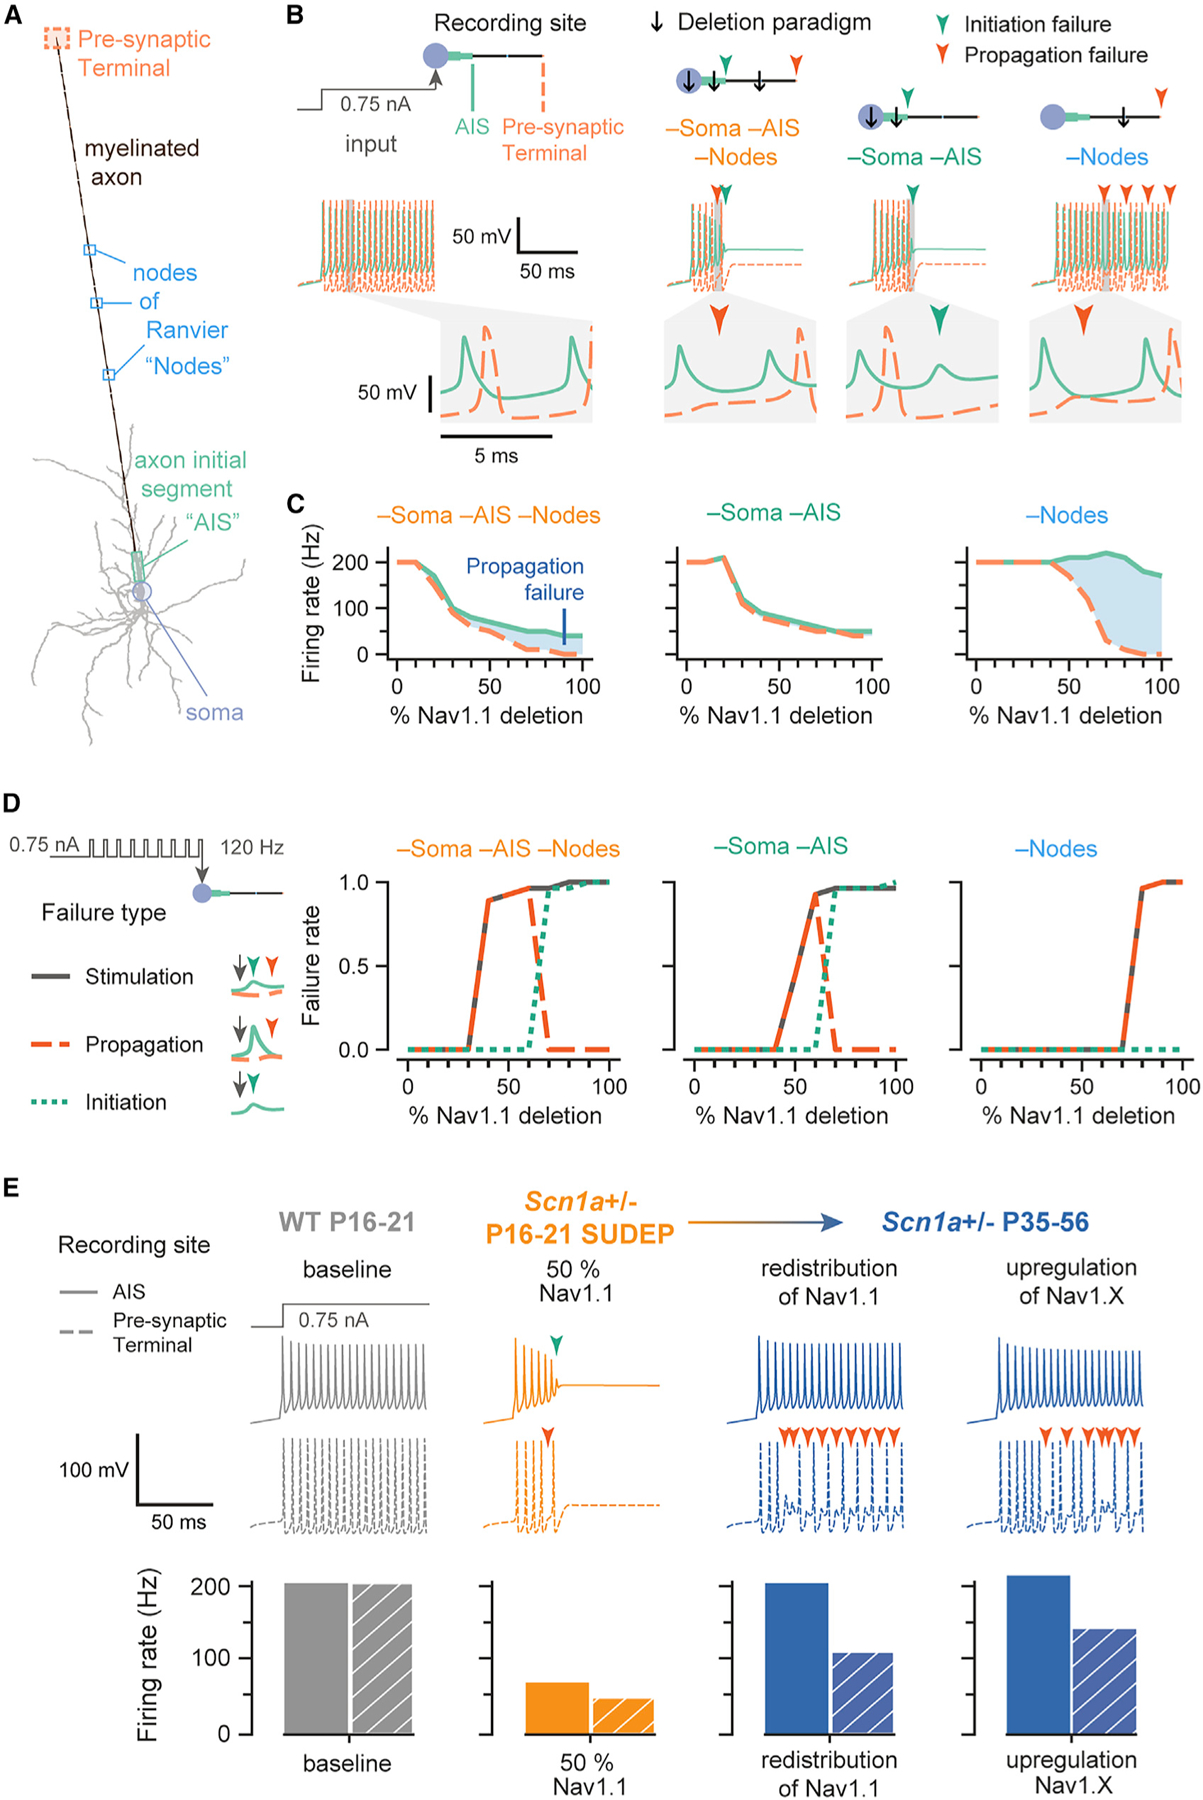
Figure 6. A multi-compartment model supports the selective effect of Na+ reduction at the axon on the fidelity of synaptic transmission at an interneuron synapse.

(A) A morphologically realistic PV-IN with a single myelinated axon, nodes of Ranvier (“nodes”), and pre-synaptic terminal.
(B) Shown are membrane potential traces recorded at the AIS (solid light green line) and terminal (dashed light orange line), following injection of 0.75 nA into the soma at t = 20 ms. The enlarged trace shows the action potential generated at the AIS and propagated along the axon to the terminal. The compartment(s) of Nav1.1 deletion is indicated by a black arrow, the combination of which is a “deletion paradigm.” Colored arrows represent the time of a failure (initiation, dark green; propagation, dark orange).
(C) Average firing rate of a neuron with progressive Nav1.1 deletion. Differences in firing rate between the AIS (solid light green line) and pre-synaptic terminal (dashed light orange line) represent propagation failures (shaded blue area), which increase with further deletion.
(D) Failure of stimulation corresponds to a pulse being delivered (at 120 Hz) but without an action potential detected at the pre-synaptic terminal within 2 ms. Failure of propagation refers to an action potential generated at the AIS that did not reach the terminal. Failure of initiation was considered to occur under conditions when a pulse was delivered, but an action potential was not generated at the AIS. For example, propagation failure in the –soma –AIS –nodes deletion paradigm first appears at 30% Nav1.1 deletion but returns to zero at 70% Nav1.1 deletion because there is no longer any spike initiation.
(E) The model generates potential explanations for the experimental observations. Traces were from the AIS (solid lines) and pre-synaptic terminal (dashed lines) with failures represented as in (B). Bar plots show the firing rate of the AIS (solid) and pre-synaptic terminal (hatched pattern). Baseline Nav1.1 in the model represents WT P16–P21 in the experimental setup (gray), while 50% Nav1.1 (in the soma, AIS, and nodes) represents Scn1a+/− P16–P21 SUDEP (orange) or Scn1a+/− P16–P21 SURVIVOR. The model can simulate different ways to recover the properties of the Scn1a+/− P35–P56 group, where action potential generation has recovered but action potential propagation is still impaired. The first is a redistribution of Nav1.1 from nodes to soma and AIS such that Nav1.1 conductance in soma and AIS was 120% of baseline (20% Nav1.1 addition) and nodal Nav1.1 conductance was 40% of its baseline (60% Nav1.1 deletion). The Scn1a+/− P35–P56 group was also modeled by upregulation of another transient sodium current by 120% in the soma and 130% in the AIS.
See STAR Methods and Figure S9 for details.
