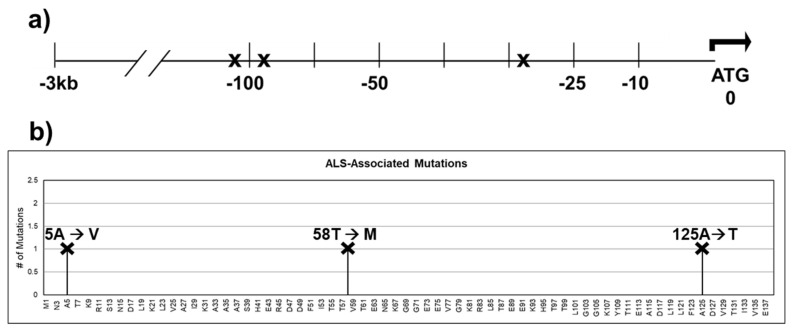
Figure 5.
SNPs identified within the 3 kb upstream regulatory region and the coding sequence of CRABP1 in ALS patients. (a) Gene diagram of the 3 kb upstream region of CRABP1 with SNPs denoted by “X”. (b) Lollipop plot indicating the location of amino acid mutations as a consequence of ALS-associated SNPs. Altered residues are marked above each lollipop.

