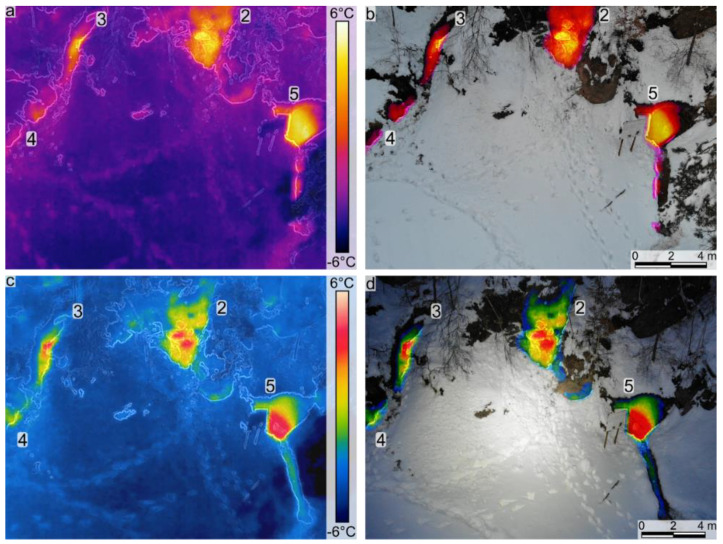
Figure 4.
Infrared thermometry photographs (a,c) and blended images between IRT hotspots and RGB photographs (b,d). Note the details on the Rainbow thermal palette (c,d; survey 4, Table 1) in comparison to the HotMetal palette (a,b; survey 3, Table 1). Note that the numbers indicate the gas measurement ID (see Table 2).

