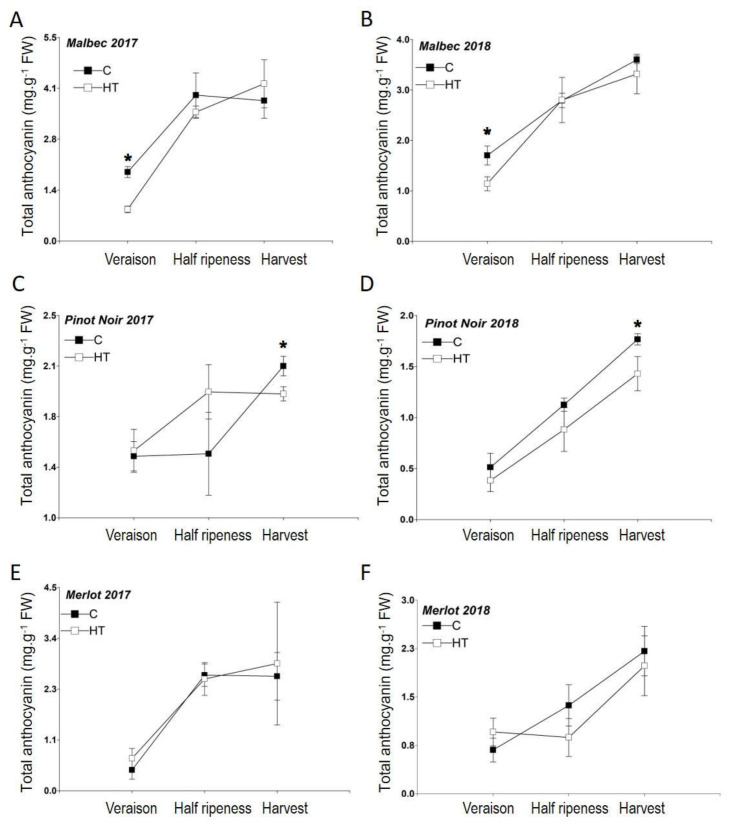
Figure 2.
Total anthocyanin concentration in berries of Malbec (A,B), Pinot Noir (C,D), and Merlot (E,F) plants grown under increased temperature (HT) and normal conditions (C) in 2017 and 2018. Error bars represent standard errors from four replicates. Asterisks indicate significantly different (p < 0.05) anthocyanin concentration between HT and C treatments for a given phenological stage, according to means comparison analysis by LSD test.

