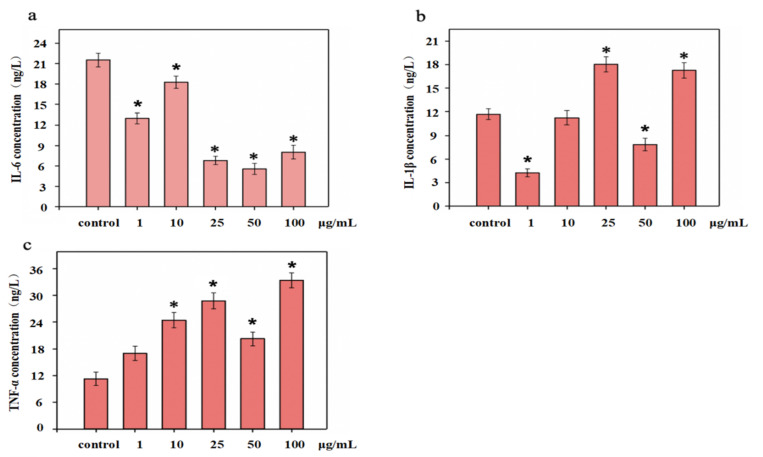
Figure 6.
Levels of cytokines in CD8+ T cells treated with varying concentrations of NTCII before LPS stimulation ((a) IL-6, (b) IL-1β, (c) TNF-α). (Shapiro-Wilk value > 0.05, using one-way ANOVA and Dunnette for post hoc tests.) An asterisk indicates that there is a significant difference compared with the control group (* p < 0.05).

