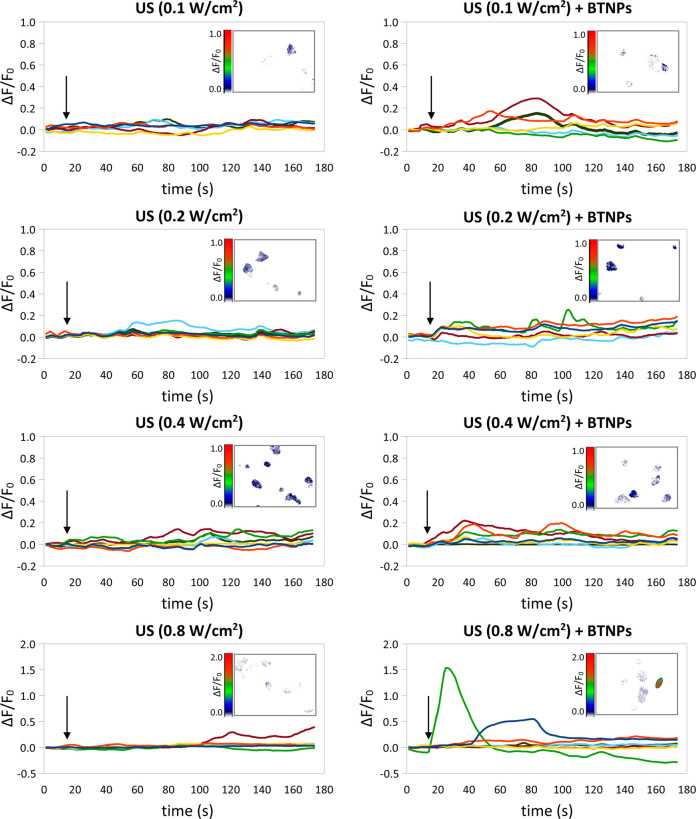
Figure 3.
Calcium imaging of SH-SY5Y-derived neurons in response to the US stimulation performed at different intensities (0.1, 0.2, 0.4 and 0.8 W/cm2), with or without BNTPs: time courses of the ΔF/F0 traces. Arrows indicate the moment when the 5-s US pulse was initiated; in the inlet of each graph a representative calcium imaging time-lapse frame is reported (at t = 30).

