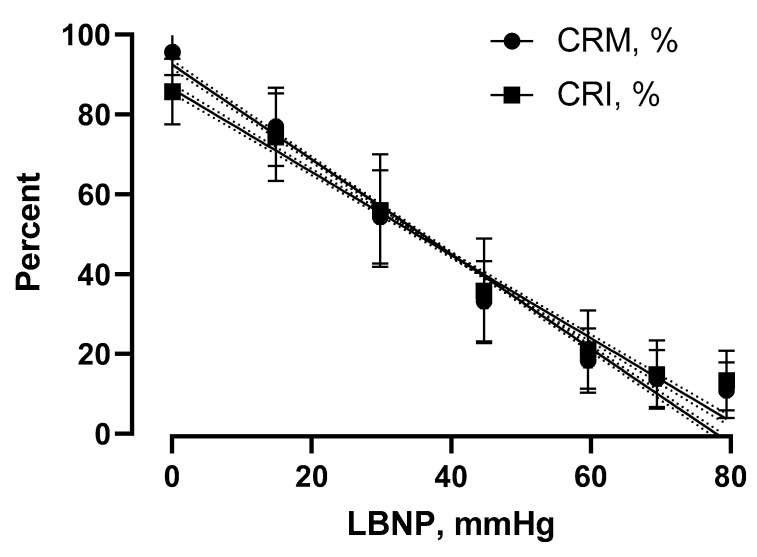
Figure 4.
Plots of linear regressions calculated between progressive LBNP levels and measurements of compensatory reserve generated from CRM (circles) and CRI (squares) algorithms. Values are the mean ± SD calculated at the end of each 5 min step of LBNP from all 191 data sets presented in Figure 3 (upper panel).

