
Figure 2.
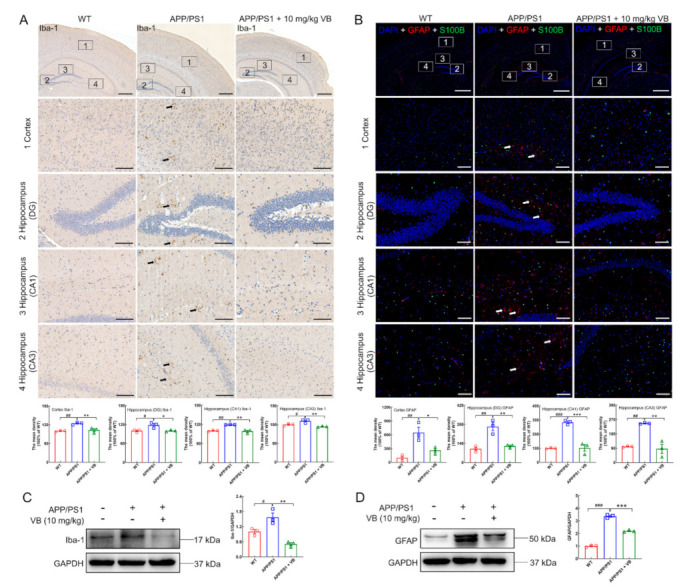
VB prevents microglia and astrocyte against activation in brains of APP/PS1 mice. (A) Representative photos and semi-quantitative data of Iba-1 in the (1) cortex, (2) hippocampus DG, (3) hippocampus CA1, and (4) hippocampus CA3 (n = 3). The black arrows indicate Iba-1-positive microglia. Scale bar = 400 μm for 50× magnification, and scale bar = 100 μm for 200× magnification. (B) Representative images and semi-quantitative data of GFAP and/or S100B in the (1) cortex, (2) hippocampus DG, (3) hippocampus CA1, and (4) hippocampus CA3 (n = 3). Red represents GFAP-positive astrocytes, while green represents S100B-positive astrocytes. The white arrows represent GFAP-positive astrocytes. Scale bar = 800 μm for 50× magnification, and scale bar = 200 μm for 200× magnification. The production of (C) Iba-1 and (D) GFAP were determined through Western blot, quantified via densitometry, and presented as the fold of WT group (n = 3). Results were presented as means ± SEM, # p < 0.05, ## p < 0.01 and ### p < 0.001 vs. WT mice, * p < 0.05, ** p < 0.01 and *** p < 0.001 vs. APP/PS1 mice.