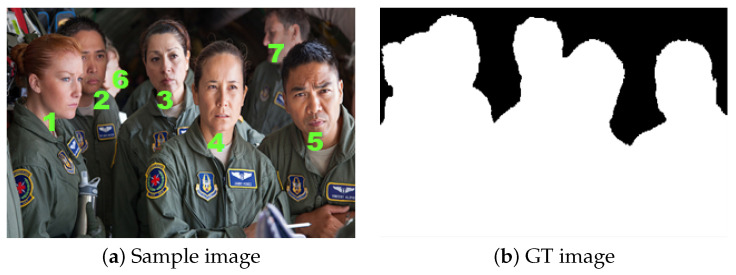
Figure 2.
The figure represents the two images, i.e., the original sample image along with its respective GT image. The sample image numerically identifies the blurred and non-blurred objects: the non-blurred objects are represented by 1, 2, 3, 4, and 5, respectively, whereas the rest are blurred objects. In the GT image, white indicates the non-blurred objects, whereas the black spots identify the blurred region.

