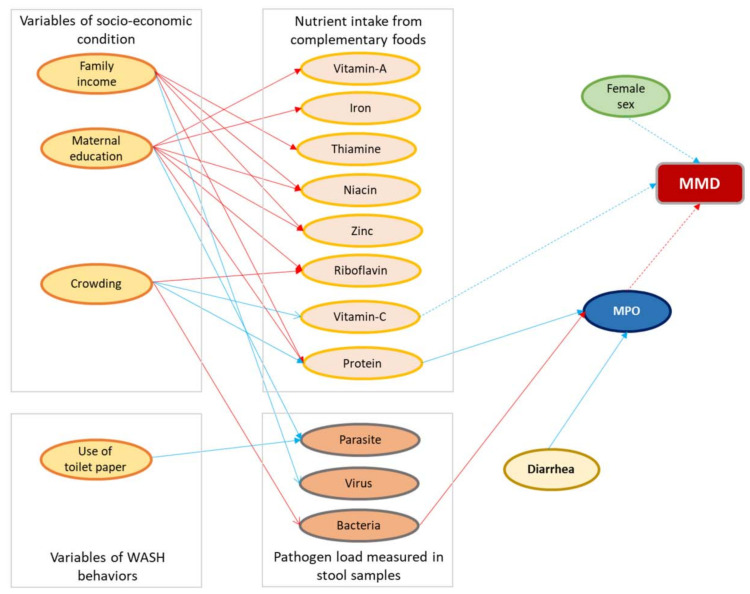
Figure 3.
Results of the multivariate Bayesian network. Arcs (arrows) are shown for parameters that did not include zero in the 95th percentile credibility interval. Positive associations are shown in red and negative in blue. The arcs with solid lines indicate linear associations and dashed lines indicate log odds. MPO, myeloperoxidase; MMD, multiple micronutrient deficiency.

