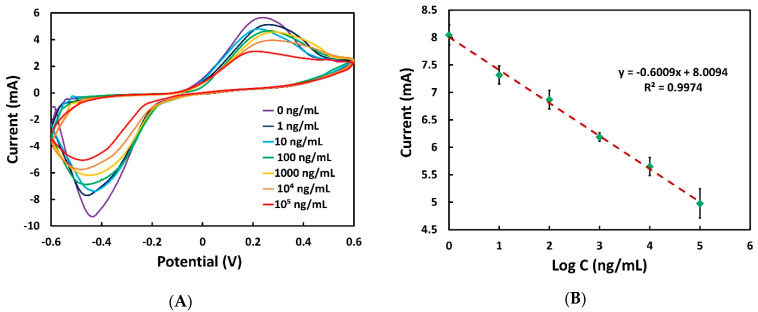
Figure 6.
(A) CV at different concentrations of CPF (0, 100, 101, 102, 103, 104, 105 ng/mL) in 0.01 M PBS. (B) Calibration plot of aptasensor for CPF detection, where the highest reduction peak current is shown in absolute value versus CPF concentration. Here, 1 µM of aptamer was used as previously optimized, and the optimized incubation time of CPF was set as 40 min. The average reduction peak current was obtained from three sensors where SD with error bar is shown.

