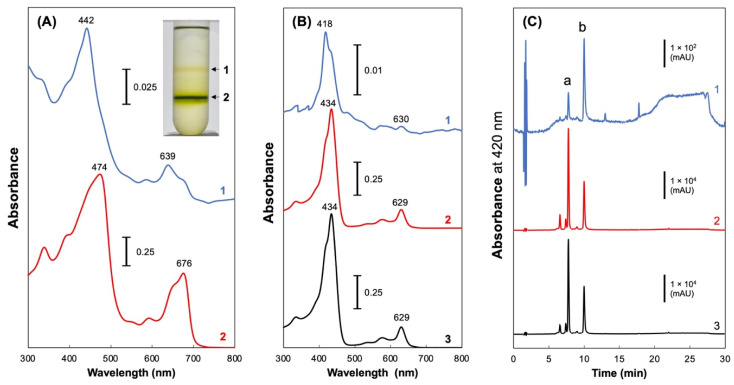
Figure 4.
Separation of pigment fractions using sucrose density gradient ultracentrifugation. After ultracentrifugation ((A), inset), two bands were collected as Fractions 1 and 2, and their absorption spectra were recorded ((A), traces 1 and 2, respectively). Absorption spectra and HPLC profiles of the methanol extracts of the Fractions 1, 2, and 0, are shown in traces 1, 2, and 3, respectively ((B,C), respectively). Peaks a and b indicate the elution of Pchlide and protopheophorbide, respectively.

