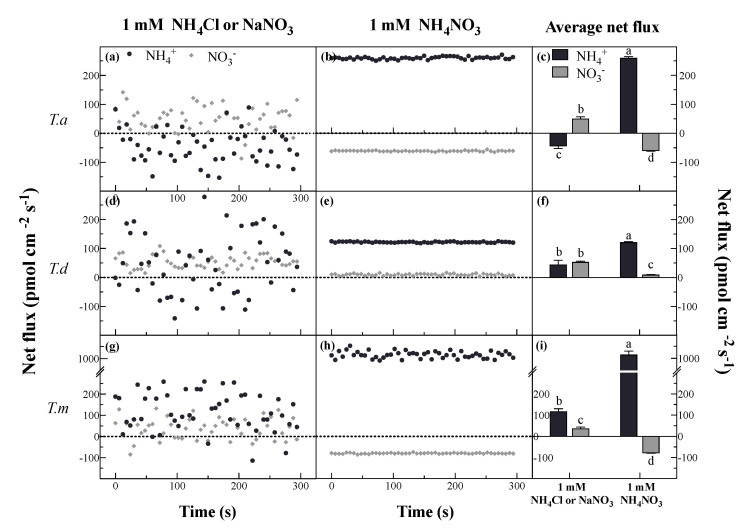
Figure 3.
Net fluxes of NH4+ and NO3− under single (a,d,g) and mixed (b,e,h) N forms, and the means of net fluxes of NH4+ and NO3− (c,f,i). Bars indicate standard errors (n = 8). Different letters indicate significant differences among the treatments according to Duncan’s Multiple Range Test at 5% level. T. a, T. d, and T. m represent T. ascendens, T. distichum and T. mucronatum, respectively.

