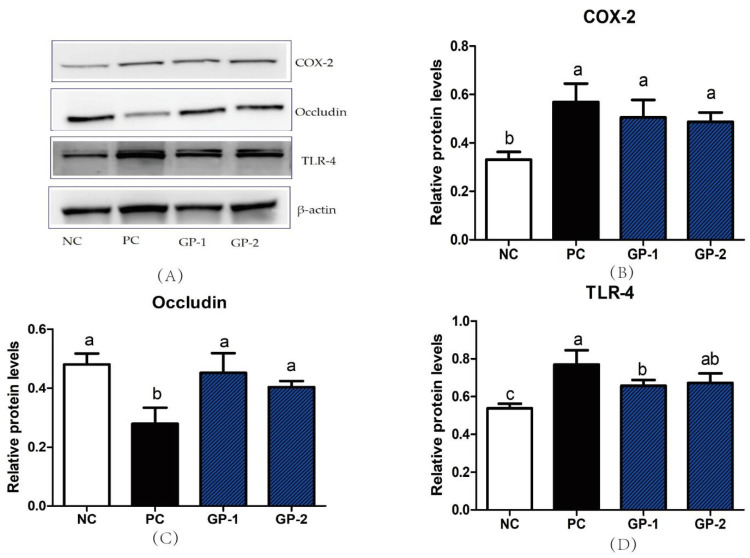
Figure 7.
Western blot of proteins in colon. All the proteins were analyzed with the comparison of β-actin. The protein bands in Western blot analysis (A). The expression of COX-2 (B), Occludin (C) and TLR-4 (D). All values represent the means ± SD (n = 4) and the different letters mean significant differences of p < 0.05 by the analysis of one-way ANOVA (Tukey’s Multiple Comparison Test).

