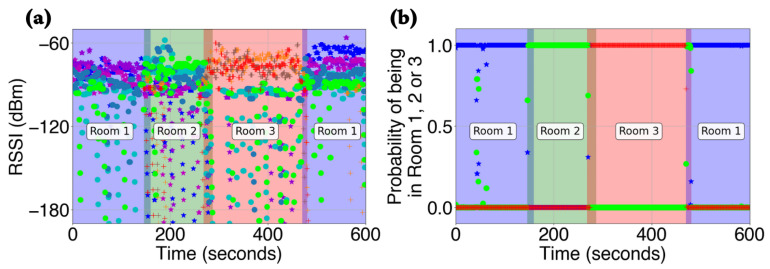
Figure 4.
Human geolocation via Bluetooth. The translucent background colors indicate the ground truth values, and the corresponding room number has been labeled. (a) The received signal strength indicator (RSSI) values as captured by each of the nine Raspberry Pis during the experiment are shown. It is measured in decibels with reference to one milliwatt (dBm). (b) The corresponding probability values of the subject being in Rooms 1, 2, or 3 during the experiment. The blue color depicts Room 1, the green color depicts Room 2, and the red color depicts Room 3.

