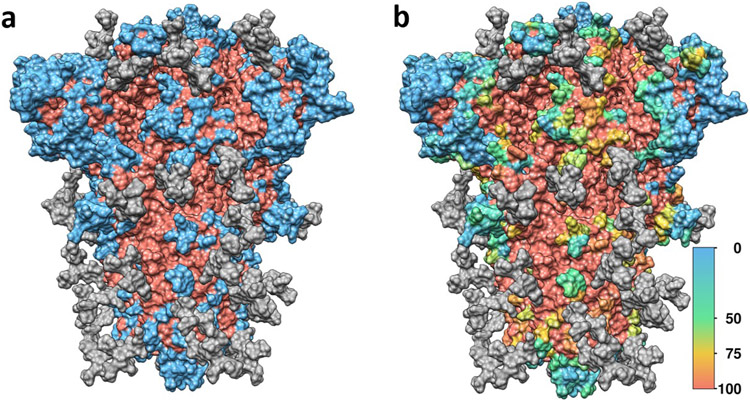
Figure 2: Antibody-accessible surface area (AbASA) of the spike glycoprotein.
a) Regions of the spike glycoprotein which have at least 0.25 Å2 of AbASA in blue, regions with less AbASA in red, and the glycosylation in gray. b) Percent change in AbASA due to glycosylation, with blue as no change, green as a 50% reduction in AbASA, and yellow a 75% reduction in AbASA. A value of 100% (red) was assigned for any residue with less than 0.25 Å2 of AbASA.

