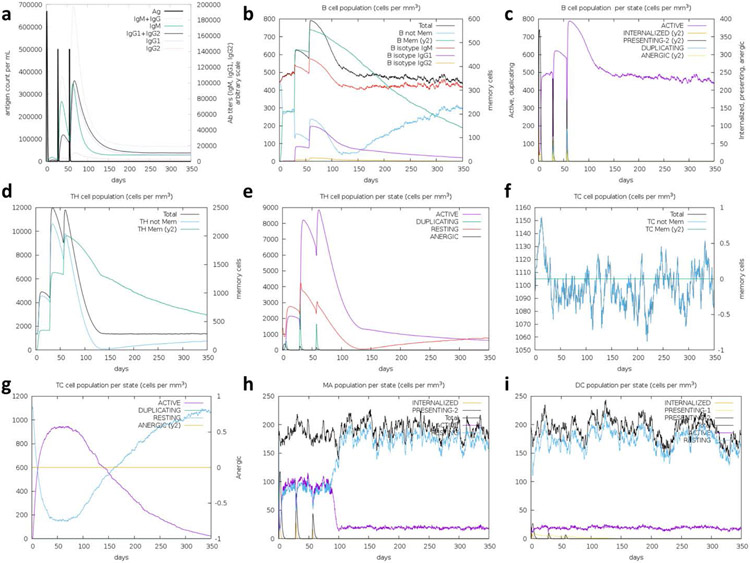
Figure 8: Immune simulation results from C-ImmSim.
Injections were simulated to occur at T = 0, 4, and 8 weeks. a) Antigen and immunoglobulin levels, subdivided per isotype; B lymphocytes by b) total count and c) population per entity state (active, presenting, internalized, duplicating, or anergic); CD4 T-helper lymphocytes by d) count and e) population per entity state; CD8 T-cytotoxic lymphocytes by f) count and g) population per entity state; total count of h) macrophages and i) dendritic cells. Supplementary Figures 6-14 include high-resolution copies of these figures.

