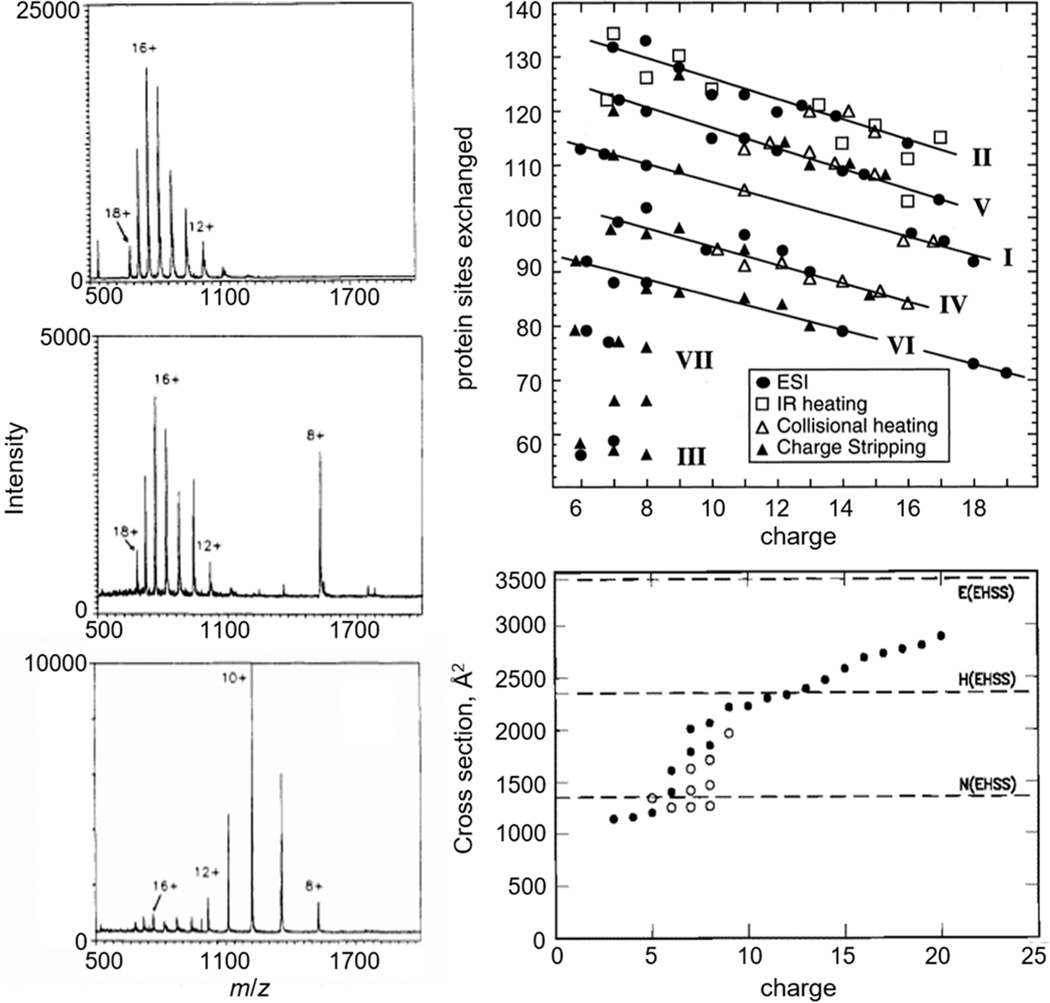
Figure 4.
Classic examples of changes in charge state and conformation of cytochrome c measured by MS depicted from ref 46 and adapted from refs 76 (copyright 1998 American Chemical Society), and 77 (copyright 1997 American Chemical Society). Left: changes in MS charge-state distribution of cytochrome c at different solvent pH: 2.6 (bottom), 3.0 (middle), 5.2 (top). Top right: isotopic 1H/2H exchange profiles of different charge states of cytochrome c in the gas phase formed by ESI (circles), IR laser heating (squares), collisional heating (open triangles), and charge stripping (closed triangles). Bottom right: cross sections of cytochrome c populated in each charge state at high (filled circles) and low (open circles) injection energies measured by IMS-MS.

