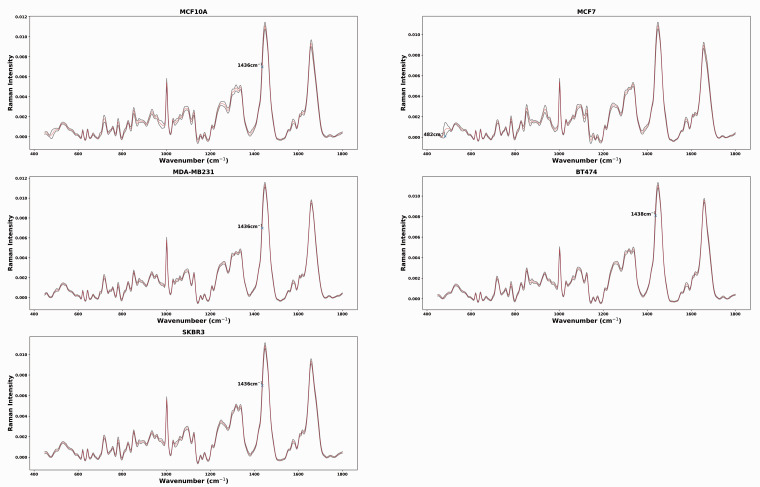
Figure 2.
Average Raman spectra obtained from MCF10A, MCF7, MDA-MB-231, BT474, and SKBR3 cells. Shadow spectrum represents ± 1 standard deviation at each wavenumber. For MCAF10A, MDA-MB-231 and SKBR3, the greatest standard deviation occurs at 1436 cm−1, which can be attributed to lipids/proteins (CH2 scissoring).30,31,51 The greatest standard deviation appears at 1438 cm−1 for BT474, which can be attributed to the change in saturated fatty acids and triglycerides. 32 For MCF7, the greatest standard deviation of MCF7 spectra is at 482 cm−1 and attributed to glycogen. 52

