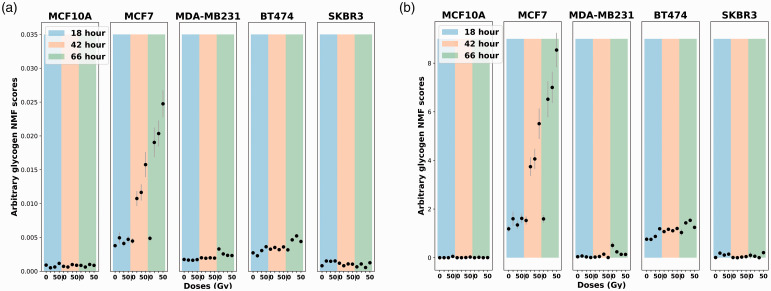
Figure 4.
Glycogen score plots comparison between unsupervised NMF and GBR-NMF across five cell lines (MCF10A, MCF7, MDA-MB-231, BT474, and SKBR3). The color bars in the background highlight the harvesting time of sample post-irradiation, 18 h (blue), 42 h (orange), and 66 h (green). Error bars represent ±1 standard error of the glycogen scores. (a) Unsupervised NMF glycogen scores. (b) GBR-NMF glycogen scores (x-axis: radiation doses in 0, 10 30, and 50 Gy; y-axis: arbitrary glycogen scores generated by GBR-NMF).

