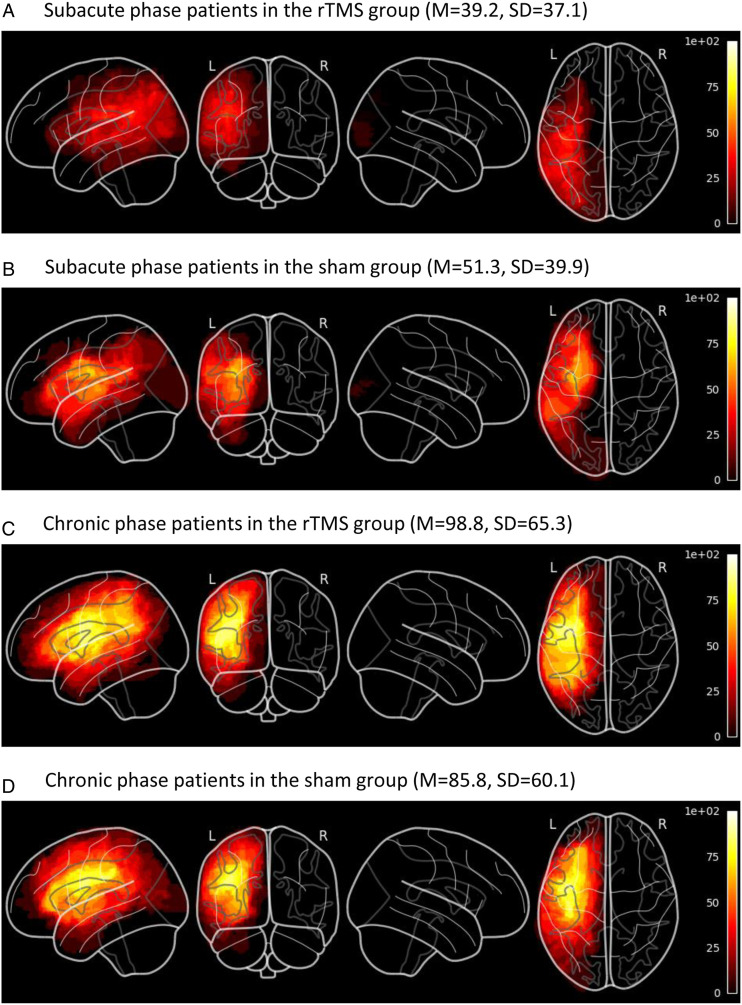
Figure 3.
Lesion overlap maps spatially normalized to MNI-stereotaxic space for subgroups of patients, and lesion volumes in mL (means and standard deviations). Lesion volumes were not significantly different in rTMS and sham groups (main effect: F [1, 54] < .01, P = .99, partial η2 = .00) and there was no statistically significant interaction between phases and treatment groups (F [1, 54] = .86, P = .36, partial η2 = .02). Patients in the chronic phase had significantly larger lesions than patients in the subacute phase (main effect: F [1, 54] = 11.97, P < .01, partial η2 = .18). (a) Subacute phase patients in the rTMS group (M = 39.2, SD = 37.1). (b) Subacute phase patients in the sham group (M = 51.3, SD = 39.9). (c) Chronic phase patients in the rTMS group (M = 98.8, SD = 65.3). (d) Chronic phase patients in the sham group (M = 85.8, SD = 60.1).

