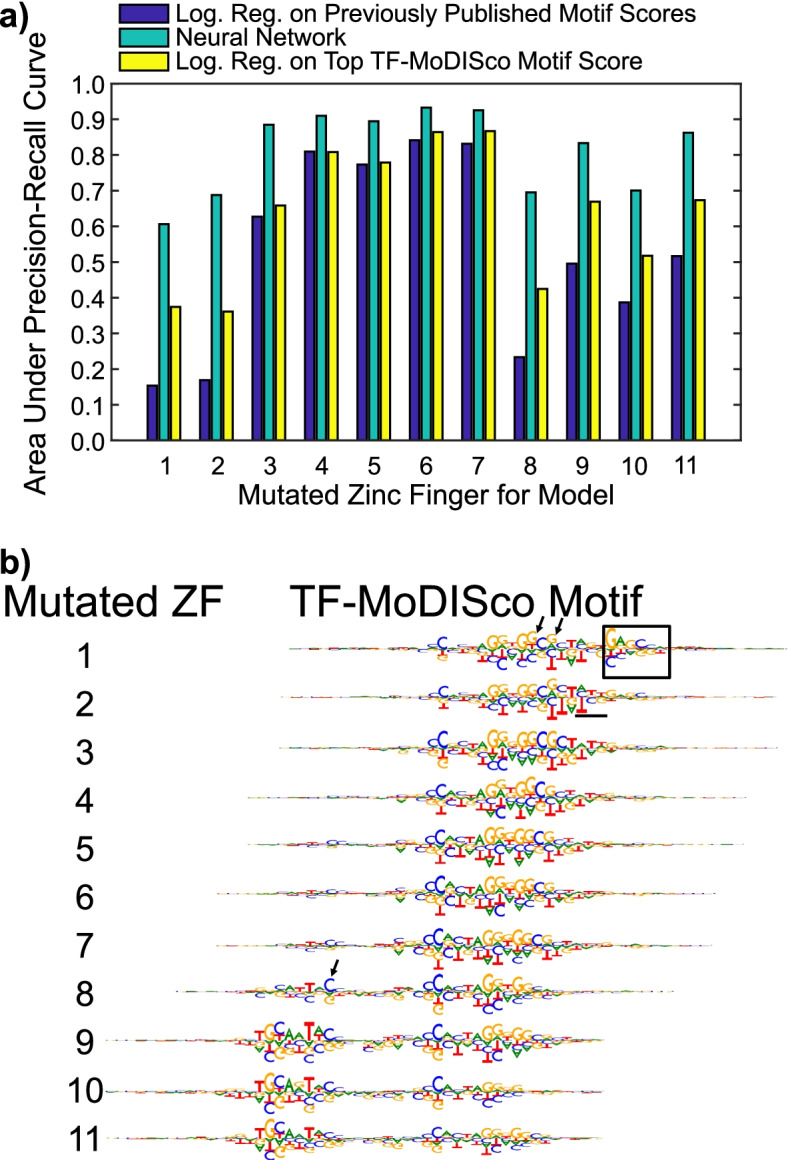
Fig. 2.

Performance of Neural Networks. a We compared the performance of our neural networks to those of logistic regressions in which the features were the motif hit scores of the motifs from [11]. We also compared both sets of models to logistic regressions with the top TF-MoDISco motif hit scores as their only features. Performance was measured by the area under the precision-recall curve (AUPRC). b We aggregated the hypothetical scores of the seqlets corresponding to the motifs from DeepLIFT followed by TF-MoDISco to visualize the TF-MoDISco motifs. The box indicates the discovered downstream motif, and the underlined part indicates the weak putative motif for ZF 2. The TF-MoDISco motif for ZF 1 has a G or a T at a position where the other TF-MoDISco motifs have a G (indicated by first arrow) and a G or an A at a position where the other TF-MoDISco motifs have a G (indicated by second arrow). The TF-MoDISco motif for ZF 8 emphasizes a downstream nucleotide in the upstream motif (indicated by arrow)
