Fig. 3.
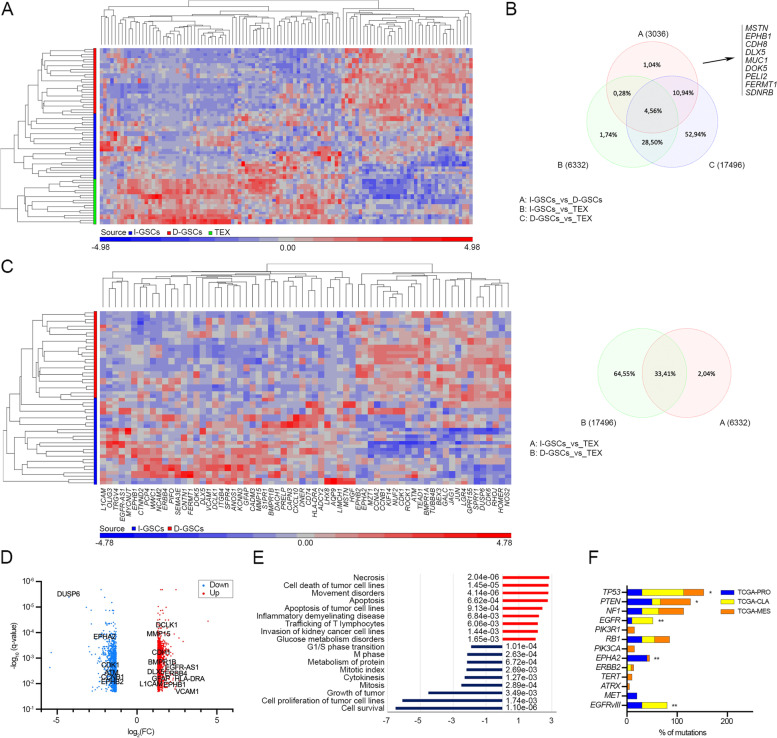
I-GSCs’ transcriptional profile is defined by migration and invasiveness. A-B Unsupervised hierarchical clustering analysis based on global gene expression profile of nine I-GSCs lines (blue), D-GSCs (red) counterpart and their GBM tissues (TEX; green) reporting a matching transcriptional signature between I-GSCs and tissue samples. Samples are coded by color. A dual-color code represents genes over- (red) and under-represented (blue), respectively (A). B Venn diagram confirming the exclusive over-expression in I-GSCs of genes mainly involved in cell migration (FDR < 0.05 and FC = 2). C. Hierarchical clustering using 66 differentially expressed genes when comparing I-GSCs to D-GSCs (left). Higher overlap of genes between I-GSCs and their original GBM tissue as compared to D-GSCs versus the same tissue, as reported by Venn diagram (right). D. Volcano plots based on expression data showing the higher infiltrative and mature, “astrocyte-like” profile of I-GSCs vs D-GSCs. Significant hits are depicted in red and blue. The top candidates are labelled. E. When compared to their D-GSCs siblings, I-GSCs’ overexpress transcripts belonging to biological functions as cell death, invasion and inflammatory/immune response, whereas downregulated mRNAs are mainly involved in cell cycle, cell proliferation and survival processes. Red and blue bars count for up- and downregulated genes, respectively. F. Distribution of the frequently mutated genes in GBM across subtype in both GSCs population and their tissue. **P < 0.01, *P < 0.05, Fisher’s exact test

