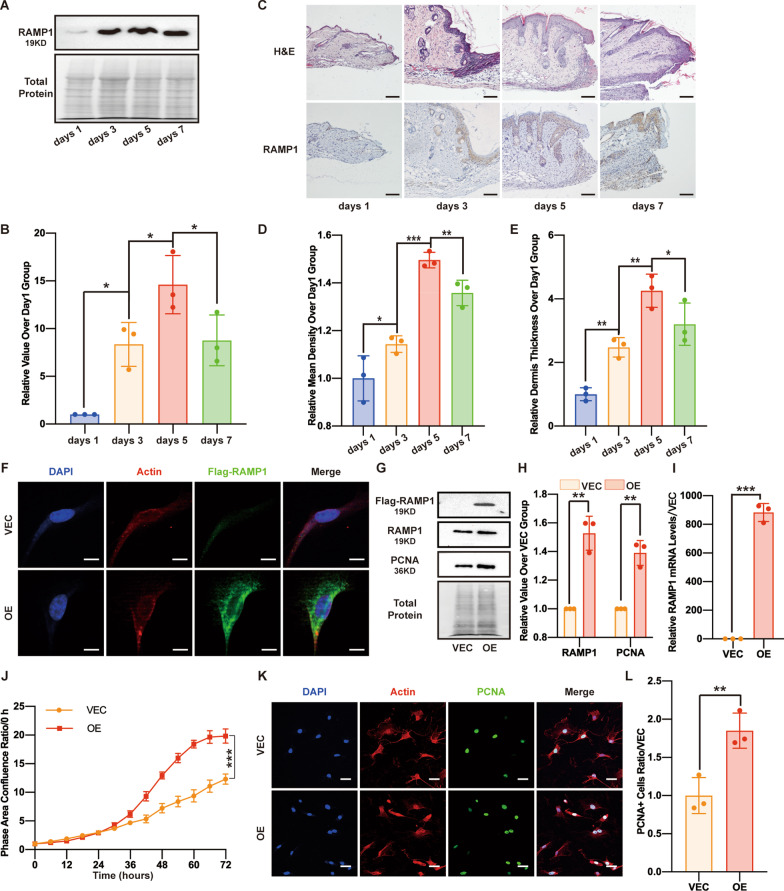
Fig. 1.
RAMP1 overexpression promotes cell proliferation. A Western blot analysis of RAMP1 in skin wound tissue proteins. Total protein was stained as an endogenous control. B Quantification of the protein band intensities in A. The data were normalized by lane normalization factor (LNF). C H&E staining and IHC staining of RAMP1 in skin wound tissue sections (10×). Scale bar = 100 μm. D Quantitative analysis of RAMP1 expression by IHC staining of C. E Dermis thickness measurements by H&E staining of C. RAMP1 OE and VECs were treated with DOX (5 μg/ml) for 48 h when the following experiments were conducted. F Confocal immunofluorescence of Flag (green), Actin (red) and DAPI (blue). Scale bar = 10 μm. G Western blot analysis of Flag-RAMP1, RAMP1 and PCNA. Total protein was stained as an endogenous control. H Quantification of the protein band intensities of G. The data were normalized by LNF. I qPCR analysis of RAMP1 mRNA levels. The data were normalized to the amount of β-actin mRNA. J Cell proliferation ability (72 h) measured by confluence measurements normalized to hour 0 calculated using IncuCyte (Essen BioScience). K Confocal immunofluorescence of PCNA (green), Actin (red) and DAPI (blue). Scale bar = 20 μm. L Dot plots show quantification of the frequency of PCNA-positive cells in each field of view. The experiments were performed in triplicate. The data are presented as means ± SD, and significant differences were evaluated using unpaired t test. *P < 0.05, **P < 0.01 and ***P < 0.005

