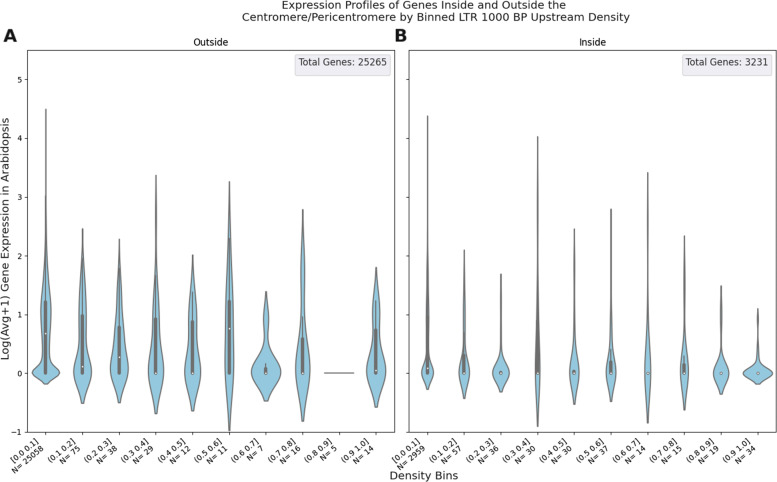
Fig. 4.
Violin Plots of TE Density vs Gene Expression in Arabidopsis: Density values are derived from the LTR TE grouping for the 1000 BP window upstream of each gene. Underneath each violin plot is the interval of TE density values that bins the genes being plotted. Underneath each density bin is N, the number of genes for that given bin. The solid dark band inside each violin represents the interquartile range (IQR) of the expression values. The white dot inside the IQR represents the median. The “whiskers” extend 1.5x past the IQR in both directions. Subplot A represents the genes that do not belong to the centromere or pericentromere. Subplot B represents the genes that do belong the pericentromere or centromere

