
FIG. 4.
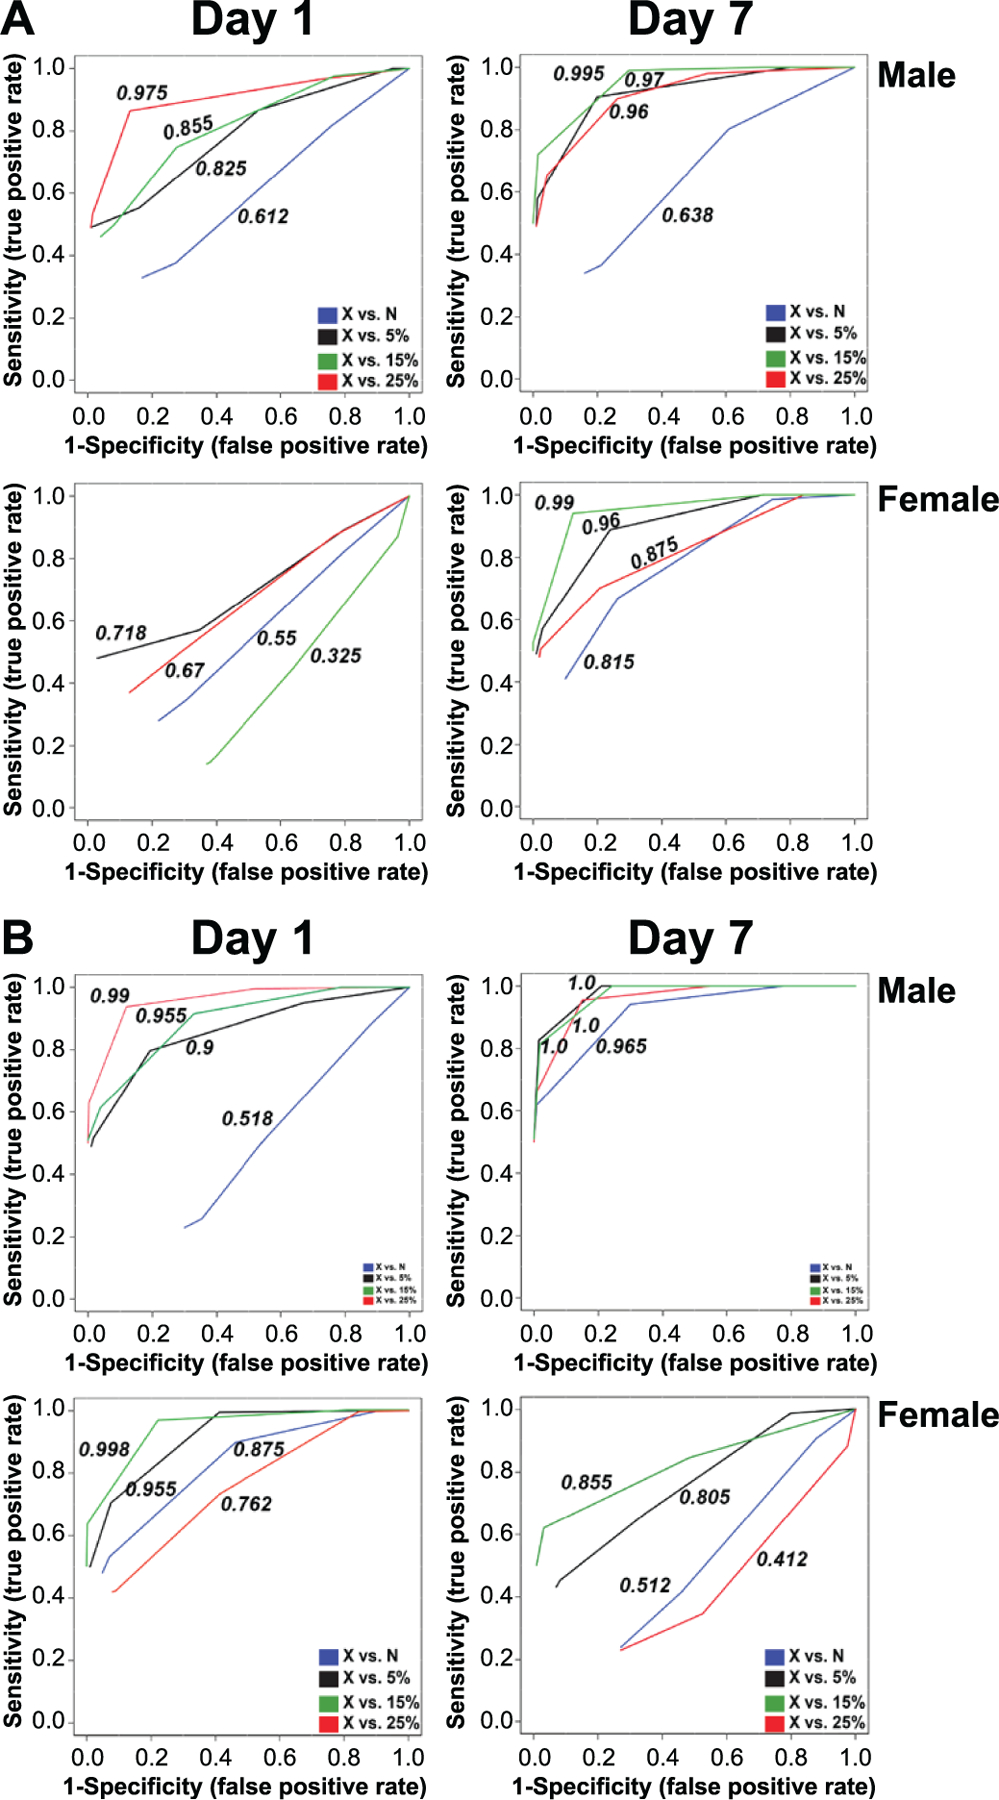
Superimposed ROC curves using Random Forests as a classification and feature ranking method, comparing neutrons and neutron-photon exposures to X rays. Each ROC curve shows the model averaged from all cross validation runs and the numbers represent the AUCs. Panel A. Urine analysis based on a biosignature of 13 metabolites from male samples extrapolated to females. Panel B. Serum analysis based on a biosignature of 18 metabolites from male samples extrapolated to females. X-axis: Specificity (false positive rate), Y-axis: Sensitivity (true positive rate). AUC >0.8 is considered a good model; AUC >0.9 is considered an excellent model.