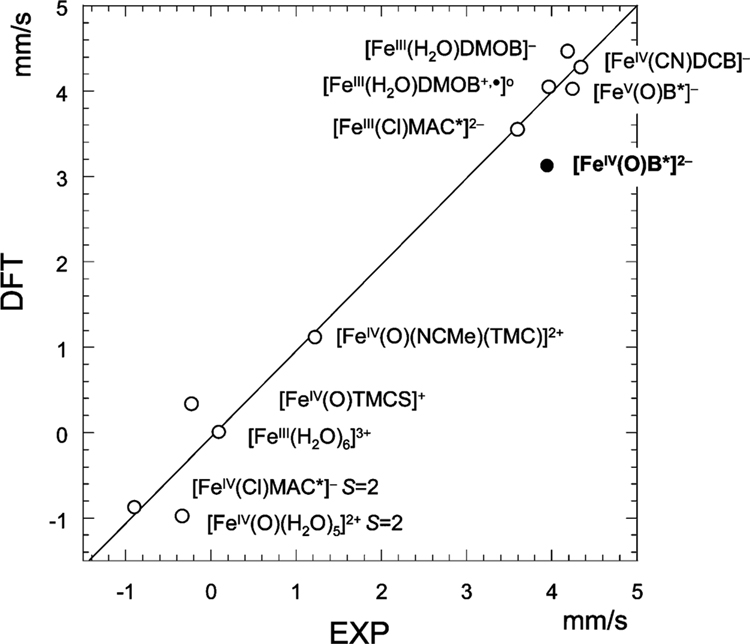
Figure 10.
Correlation between DFT calculated and experimental quadrupole splittings for three different ligand systems.4,6,19,20 The factor for the conversion of the quadrupole splitting from atomic units to mm/s is taken as −1.43 mm s−1/AU to obtain a regression line with a slope of 1. Correlation coefficient R2 is 0.96. Complex 2 is indicated with a solid dot.

