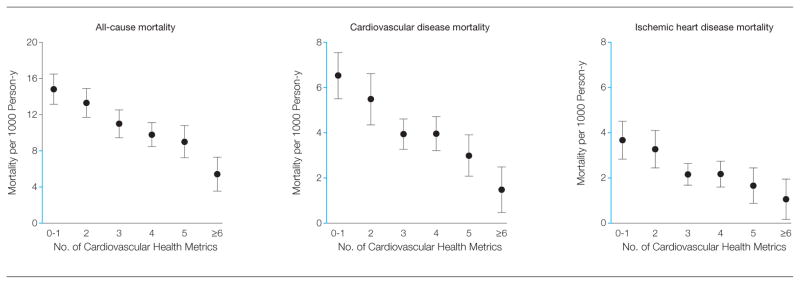
Figure 1.
Age- and Sex-Standardized Mortality Rates per 1000 Person-Years of All-Cause, CVD, and IHD Mortality, by Number of Cardiovascular Health Metrics—NHANES III Linked Mortality File
Error bars indicate 95% CIs. Y-axis segments shown in blue indicate range from 0 to 8. CVD indicates cardiovascular disease; IHD, ischemic heart disease; NHANES, National Health and Nutrition Examination Survey.

