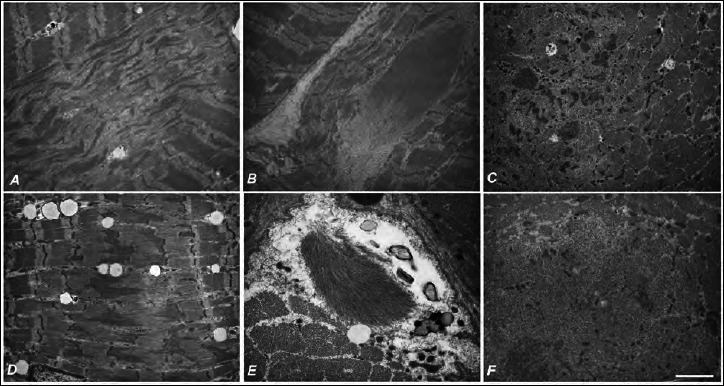
Figure 2.

Ultrastructural observation. Central areas of myofibrillar disorganization (A, C, F). Inclusion of thin filaments in the sarcoplasm and in the subsarcolemmal region (B, E). Disruption of the Z-bands with longitudinal streaming of Z-band material, and a slight increase in lipid droplets (D). Scale bar: 2270 nm (A-D), 1420 nm (E, F).
