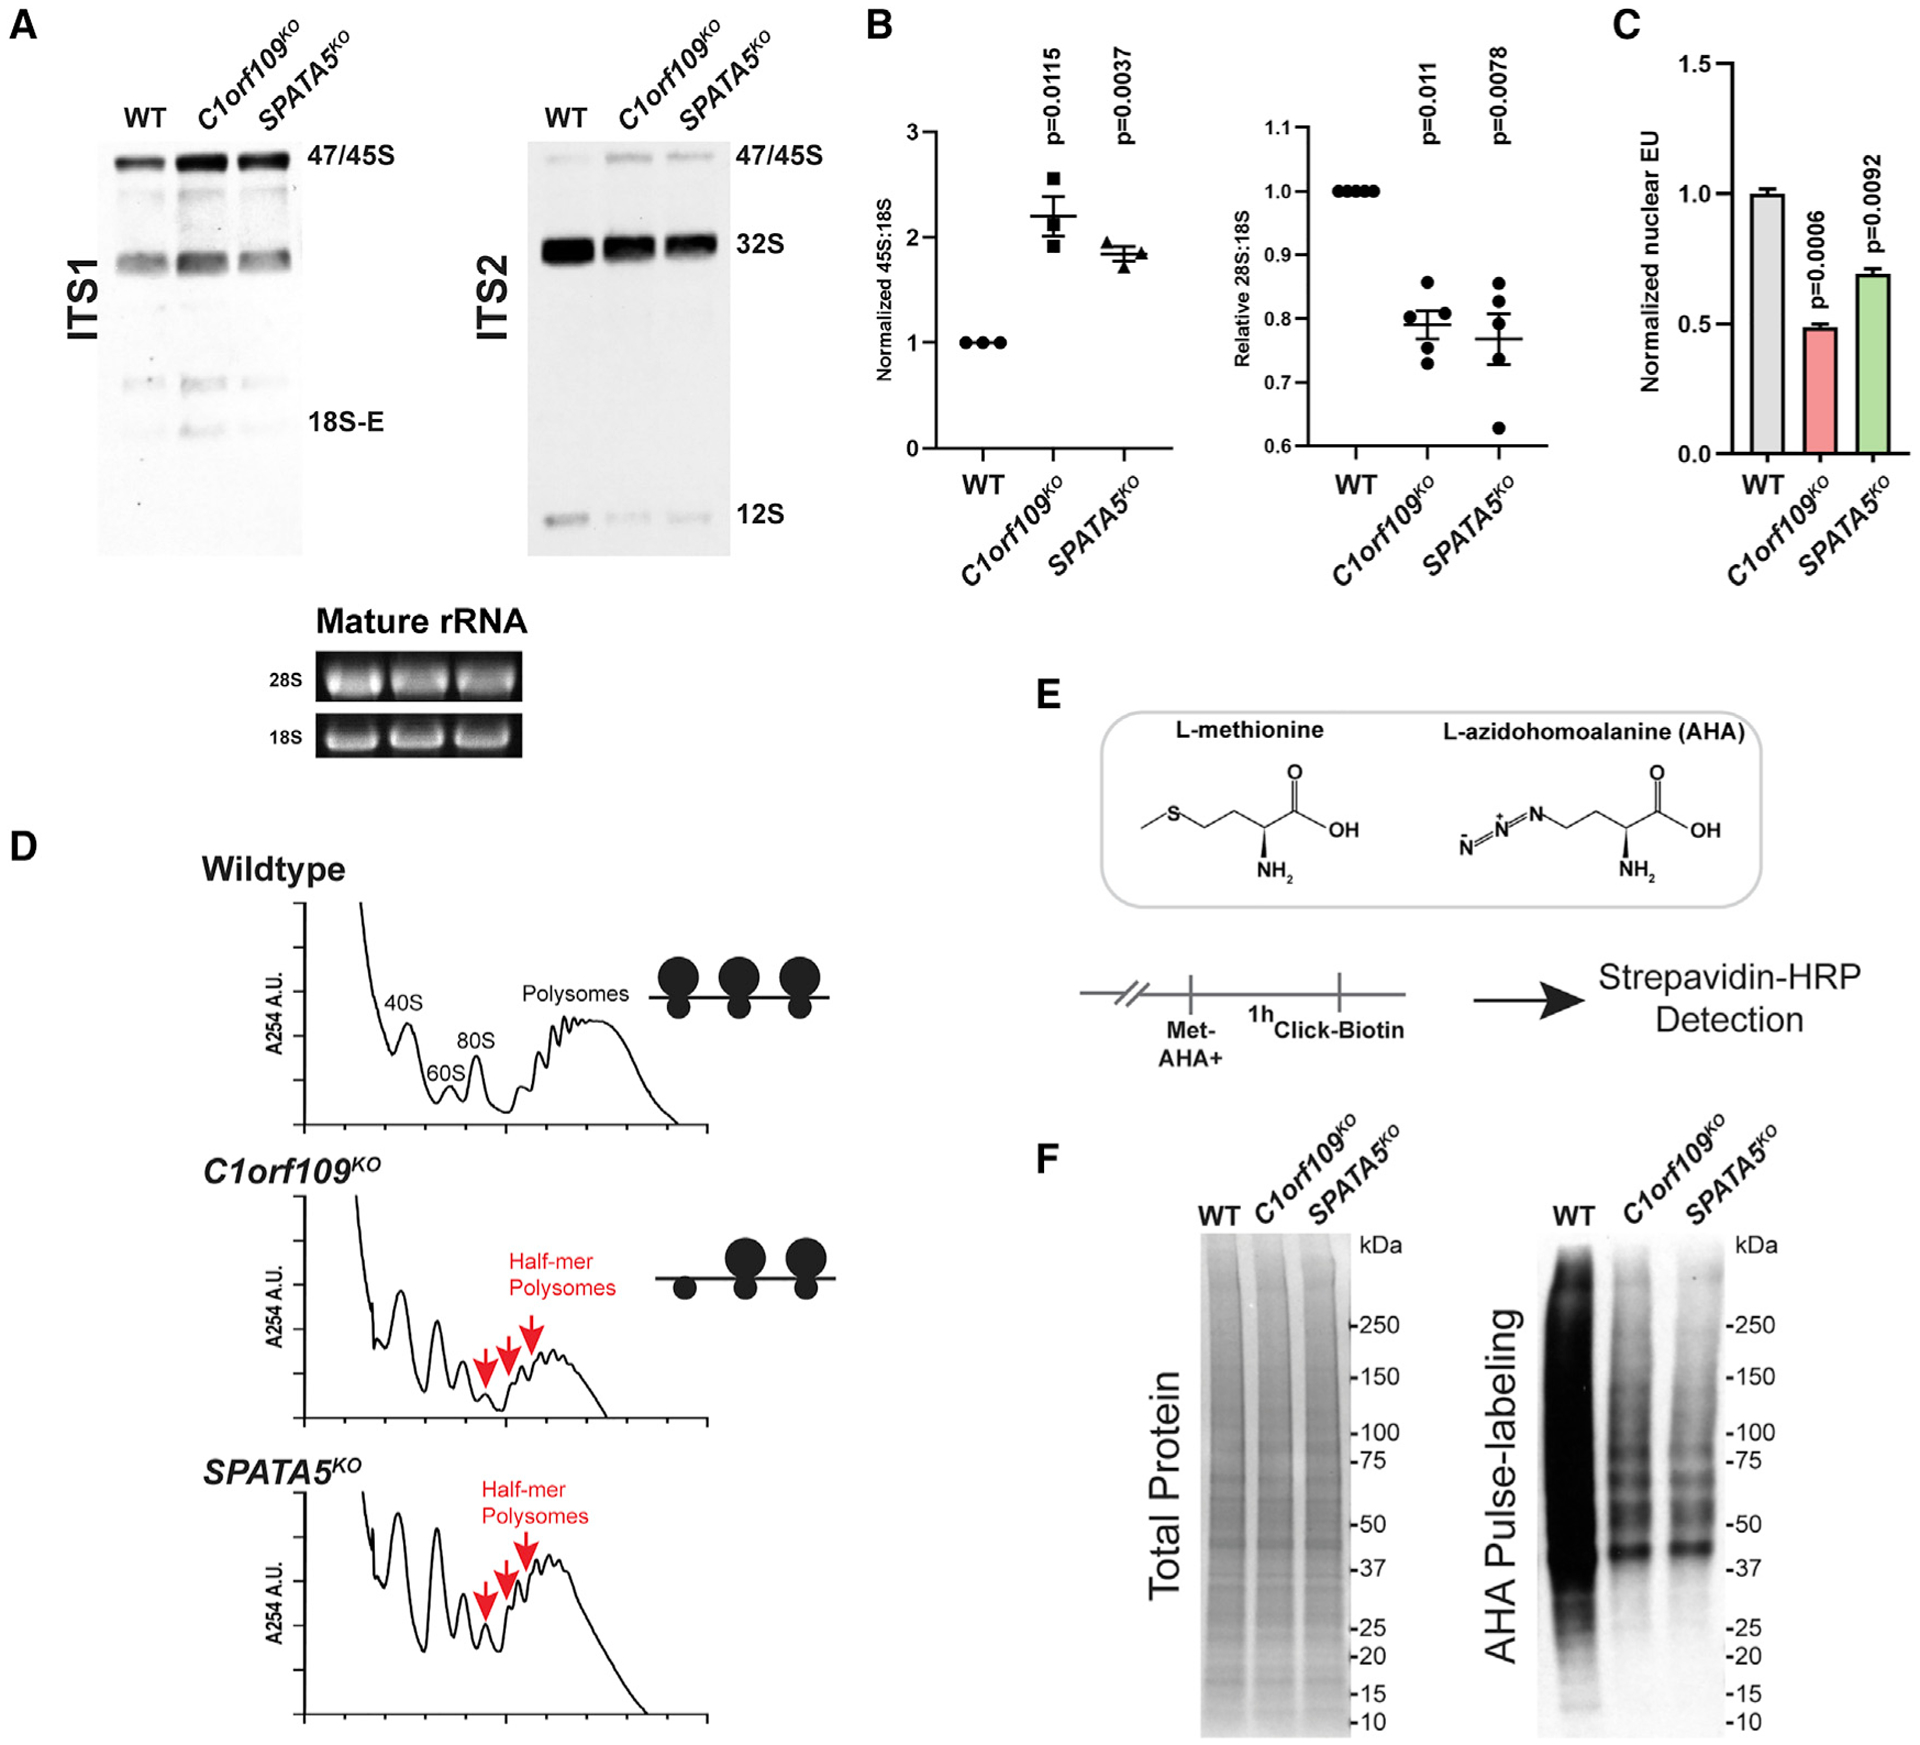
Figure 3. C1orf109 and SPATA5 mutant cells display defects in ribosome assembly and protein translation.

(A) Northern blot analysis for pre-rRNA species reveals that disruption of C1orf109 and SPATA5 results in an increase of pre-47S/45S rRNA and a reduction in 12S rRNA in HEK293T cells.
(B) Quantification of northern blot results. n = 5 biological replicates (left) and n = 3 biological replicates (right). Mean ± SEM is shown. p values were calculated using a ratio-paired t test.
(C) Quantification of EU labeling in wild-type, C1orf109KO, and SPATA5KO (n = 3 biological replicates), Values were normalized to the mean of wild type. Mean ± SEM is shown. p values were calculated by nested one-way ANOVA with Dunnett’s multiple comparisons test.
(D) Polysome profiles from wild-type, C1orf109KO, and SPATA5KO cells. Red arrows indicate half-mer polysomes, which reflect defective 60S biogenesis.
(E) Schematic describing AHA pulse labeling of ongoing protein synthesis.
(F) Total protein as assayed by Ponceau (left) and biotin labeling of AHA-labeled proteins (right) in wild-type (WT) control, C1orf109KO, and SPATA5KO cells.
