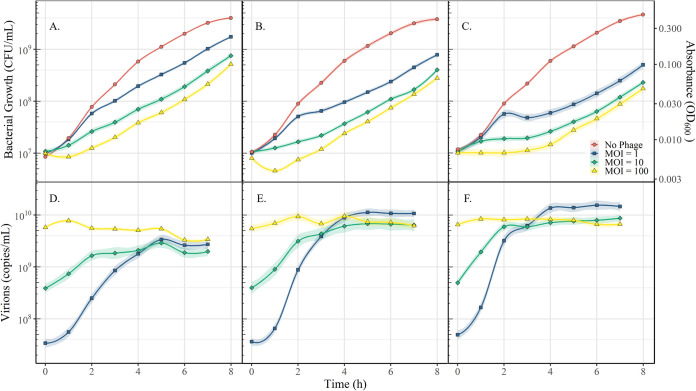
FIG 4.
The effect of a targeted CRISPR-Cas response to phage ΦEa21-4 during infection of Ea6-4. Panels (A), (B), and (C) represent the CFU/ml calculated from OD600 measures for Ea6-4 transformed by pEA-CRR1Φ, pEA-CRR2Φ, and pUC19, respectively. Panels (D), €, and (F) represent the virion quantification through qPCR for ΦEa21-4 corresponding to (A), (B), and (C), respectively. Red, blue, green, and yellow symbols represent the mean of the triplicate for no phage, MOI of 1, MOI of 10, and MOI of 100, respectively. MOI was confirmed through plaque assay. The line represents the local regression model of the data (LOESS), and the shaded region represents a 95% confidence interval.

