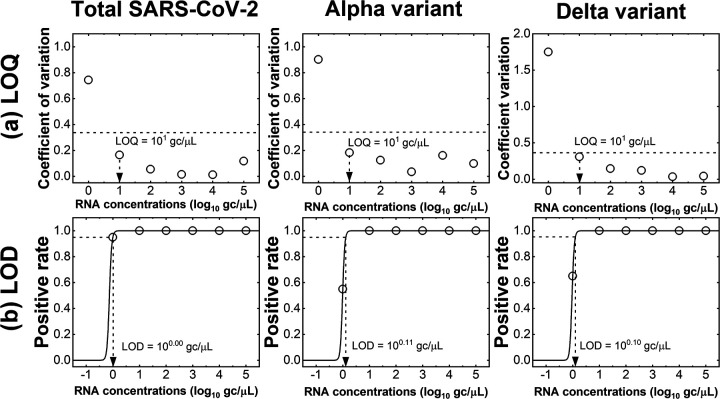
FIG 5.
Determination of sensitivities (i.e., LOQs and LODs) of RT-qPCR assays for total SARS-CoV-2, Alpha variant, and Delta variant. (a) Dashed lines indicate the coefficient of variation at 0.35. (b) The trend lines for positive rate (solid lines) were calculated using equation 6. The LODs were the RNA concentration at which the positive rate was 0.95 (dashed lines).

