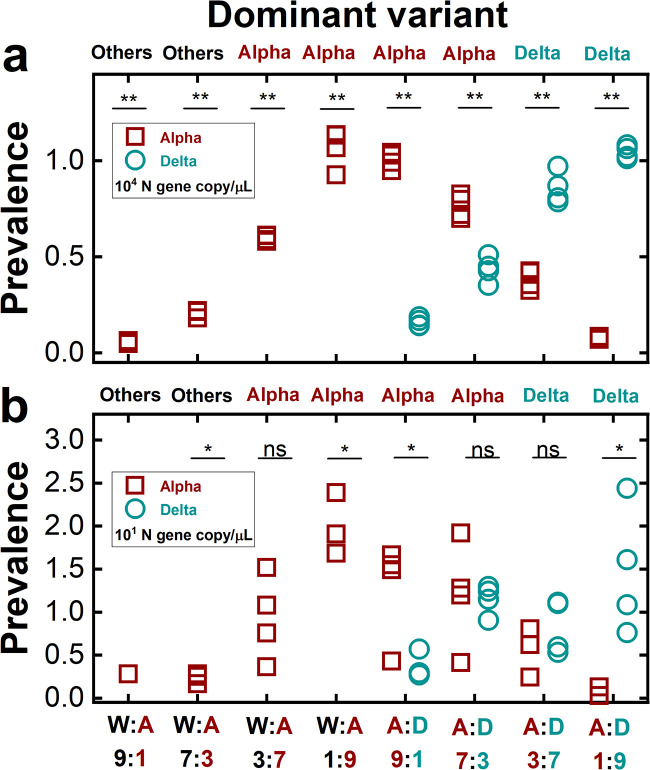
FIG 7.
Dominant variants of the mixtures of synthetic RNA controls determined by RT-qPCR assays. Total SARS-CoV-2 concentrations were determined by the N gene concentrations at 104 gc/μL (a) and 101 gc/μL (b). Prevalences on the y axis indicate the ratio of the concentration of each variant to the total virus concentration. The x axis shows the mixing ratios of different synthetic RNA controls (W, A, and D represent WT, Alpha variant, and Delta variant, respectively). The label at the top of each graph (others, Alpha, or Delta) indicates the dominant variant determined by the RT-qPCR assays. A one-sample t test or a two-sample t test was conducted to compare the prevalences between the Alpha variant and 0.5 or the prevalences between the Alpha and Delta variants (nonsignificant [ns], P > 0.05; *, 0.001 < P < 0.05; **, P < 0.001), respectively.

