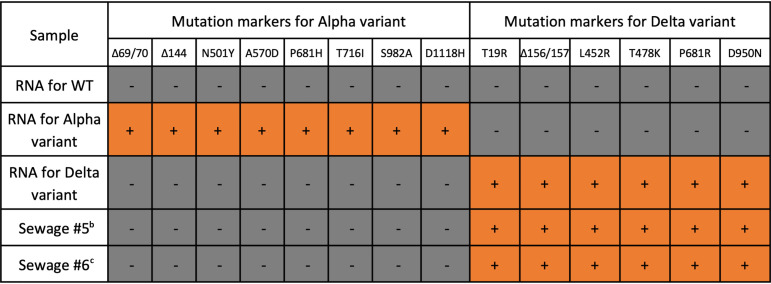
TABLE 2.
Comparisons between RT-qPCR assays and NGS analysisa

|
+ symbols in orange cells represents mutations that were detected, while − symbols in gray cells indicate mutations that were not detected.
bGISAID accession ID is EPI_ISL_10113885.
cGISAID accession ID is EPI_ISL_10113884.
