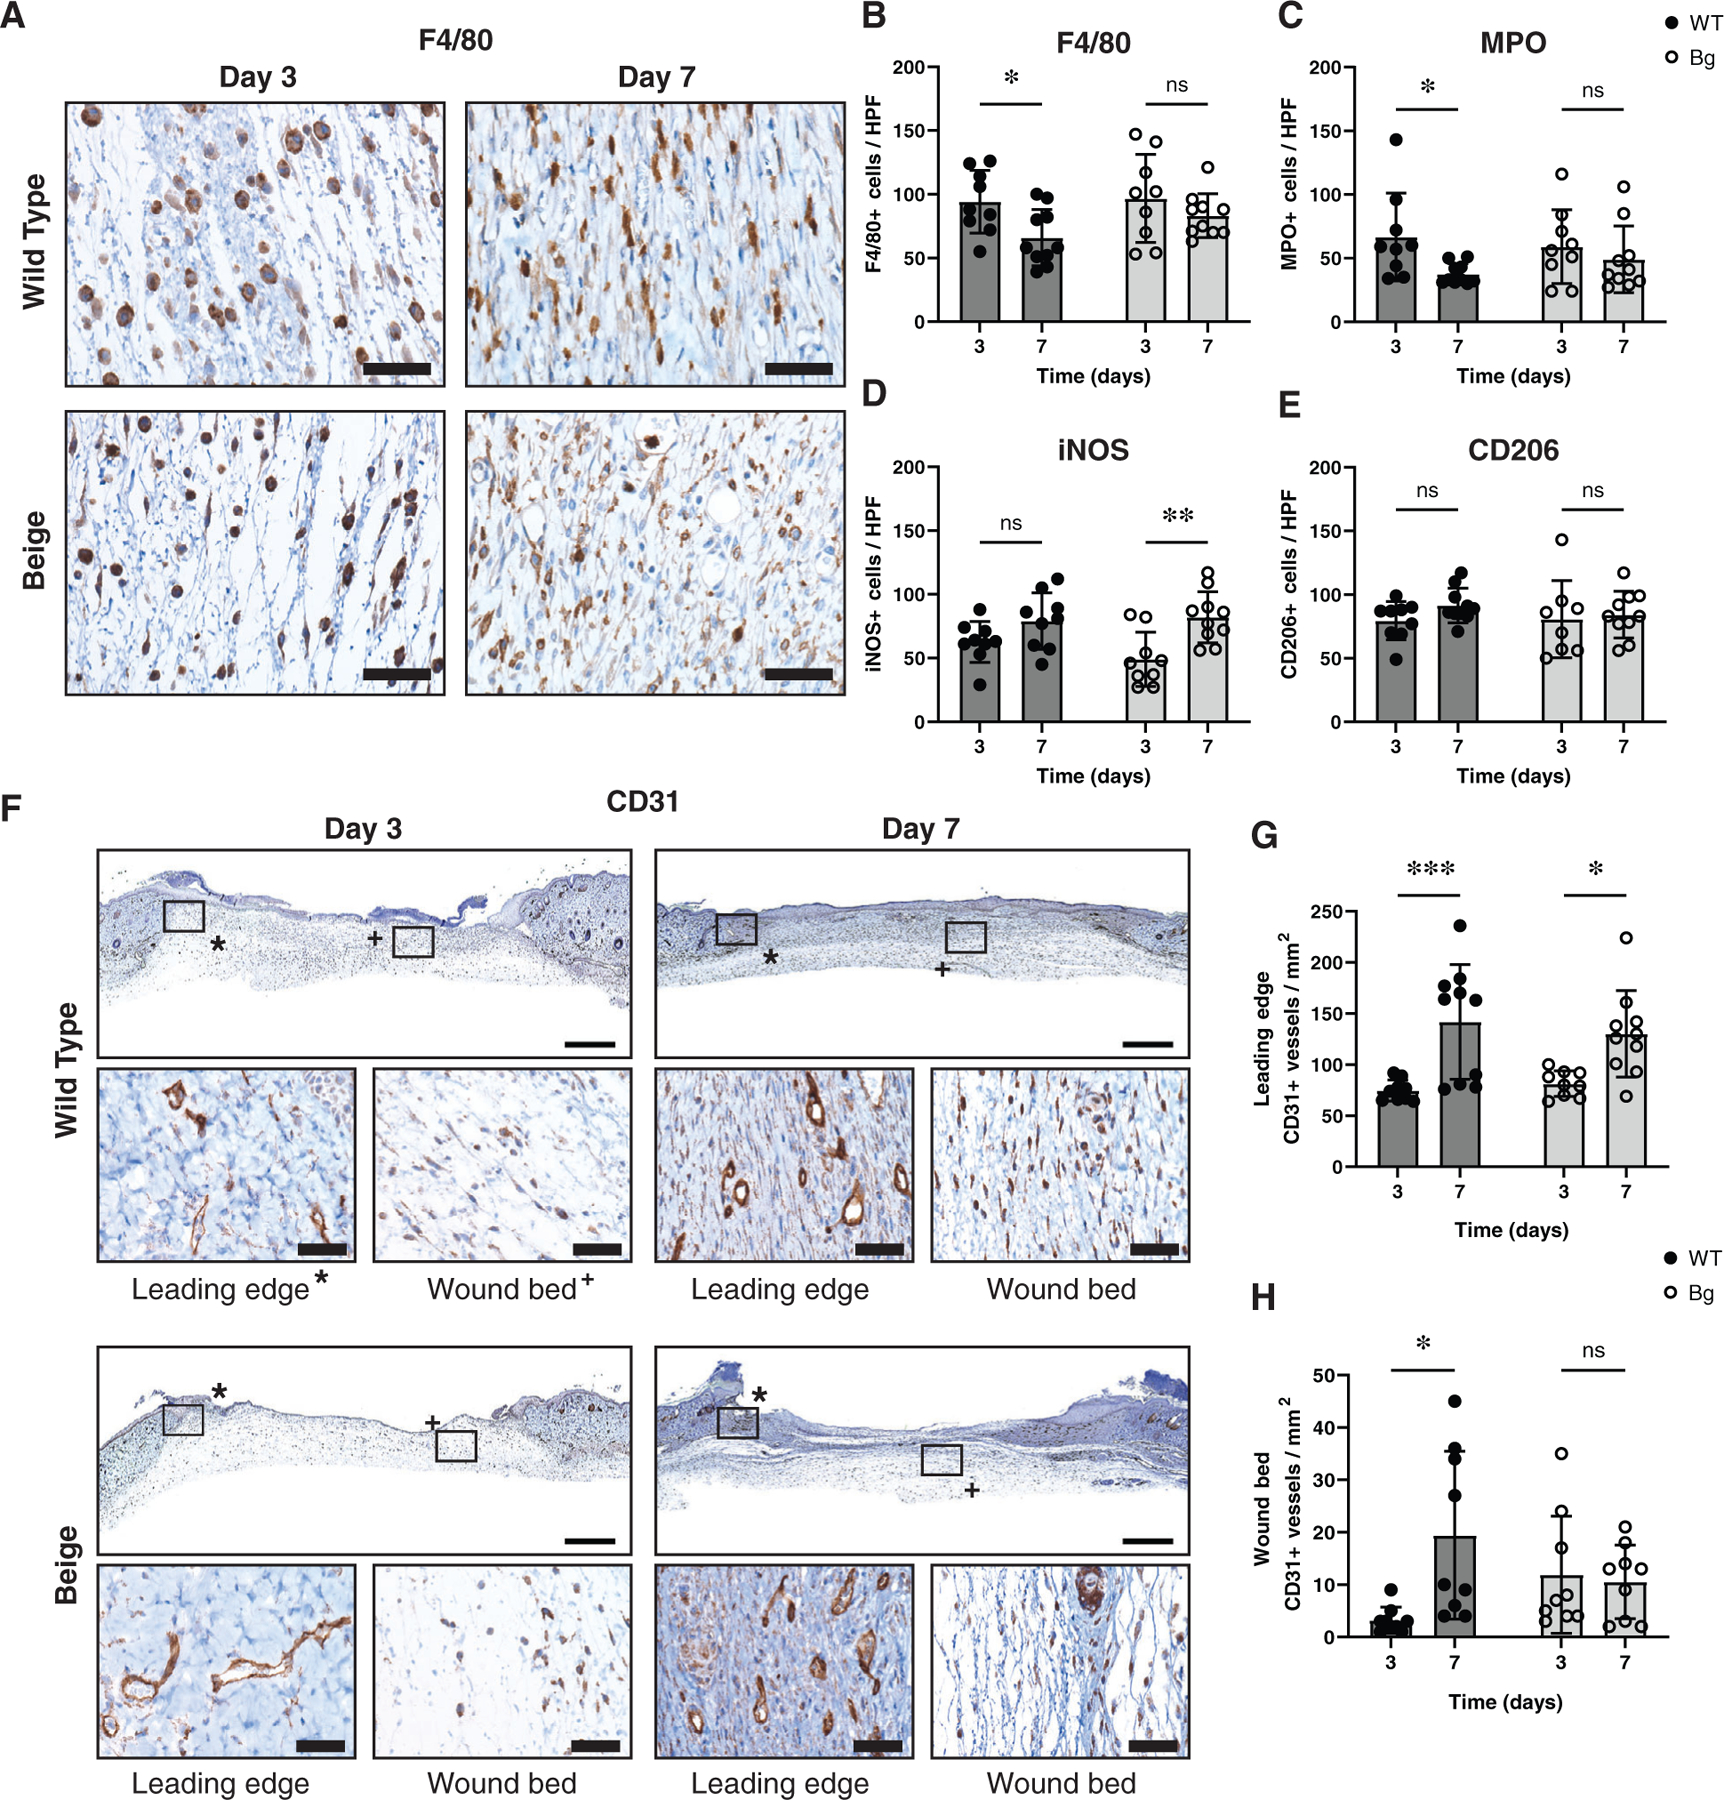
FIGURE 2.

Macrophage characterisation and wound vascularization. (A) Representative images of F4/80+ macrophage infiltration in the wounds. (B) Quantification of the number of F4/80+ cells per high powered field (HPF) show no differences between genotypes at either time point but WT did decrease between days 3 and 7 (p = 0.0388). (C) Similar results are seen with MPO+ neutrophils, with no differences between genotypes at either time point but WT did show a decrease between days 3 and 7 (p = 0.0404). (D) iNOS, an inflammatory marker, showed an increase in the number of iNOS+ cells between days 3 and 7 for Bg wounds (p = 0.0022) but no differences between genotypes. (E) CD206, an anti-inflammatory marker, showed no differences between genotypes or time points. (F) Whole wound sections stained to show CD31+ vessels with representative high magnification images of the leading edge of the wound (*) and the wound bed (+). (G) The number of CD31+ vessels per area in the leading edge of the wound increased between days 3 and 7 (p = 0.0007 for WT and p = 0.0142 for Bg) but no differences were seen between genotypes. (H) The number of positive vessels in the wound bed showed only an increase in vessels in WT between days 3 and 7 (p = 0.0123). Scale bars for high magnification images = 40 μm and low magnification images = 1 mm. *p ≤ 0.05, **p ≤ 0.01, ***p ≤ 0.001 (n = 9–10 per group)
